Examples of daily CO2 variations (CO2 measured at ground level)
(this page to document a www.realclimate.org discussion (here) on the amplitude of daily CO2 variations)
francis.massen@education.lu
12 April 2005
file: daily_co2.html
version 1.0
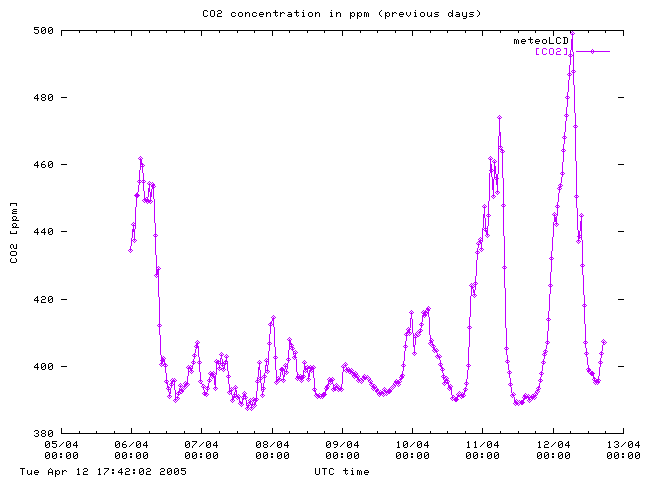
1. picture of CO2 measured at meteoLCD
station: semi-rural, no heavy industry, sample inlet at 25m above ground,
height asl = 218m (longitude East = 6°, latitude North = 50°) (http://meteo.lcd.lu)
Maximum concentration usually at ~06:00 UTC ( = coldest time of the day)
Correlations with solar radiation always give negative slope (CO2 diminishes
when solar radiation goes up), same with temperature
(temperature and solar radiation are not independent)
This big variation is at least partially due to photosynthesis (varaiations are smaller during full greening season)
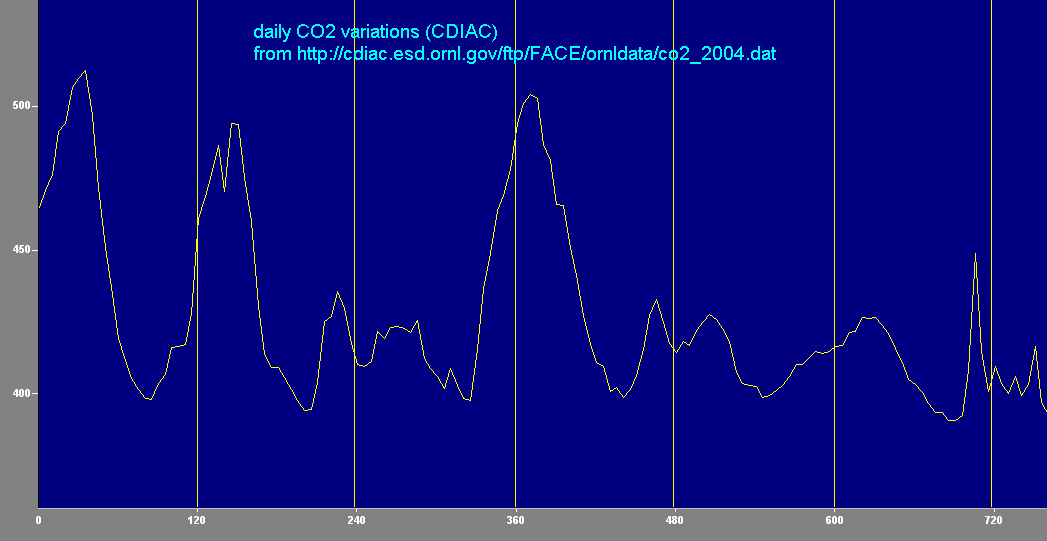
2. picture of CO2 computed from a subset
of CDIAC database (http://cdiac.ornl.gov/ftp/pub/FACE/ornldata/co2.txt):
ORNL face CO2 data, october 2004
3. Text from French Office National de
la Forêt (ONF): MORTIER F. 1995.
Le CO2 et la forêt. ONF Bull. Tech. n°29 (Numéro spécial).
"La distribution du CO2 n'est pas uniforme dans l'atmosphère ; l'analyse des résultats doit tenir compte :
- des variations temporelles horaires (jusqu'à 80 ppm), journalières (5-25 ppm)...
"
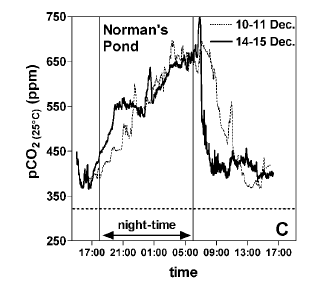
4. from paper of Frankignoulle et al. (Caribean Journal of Science, Vol.39, No.3, p.257-264, 2003)
end of file