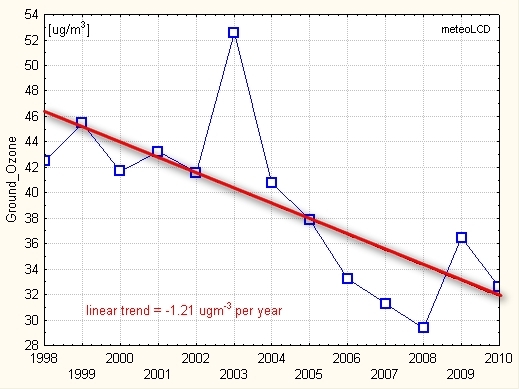
("bad ozone")
negative trend: -1.2 ug/m3 per year
mean : 39.1 ug/m3
stdev: 6.5
("good ozone")
positive trend: +2.3 DU per year
(+1.4 without year 1999; Uccle gives +0.95 for the 1998-2010 period) (see also [16])
calibration
factor applied if needed!
Uccle data from
WOUDC
(stat.53, Brewer#16)
mean : 322.0 (Uccle: 328.4)
stdev : 15.5 (Uccle:
7.1)
See [4] [8]
([8] shows strong
positive trend starting 1990 for
latitudes 45°-75° North, Europe):
See also recent EGU2009 poster [16].

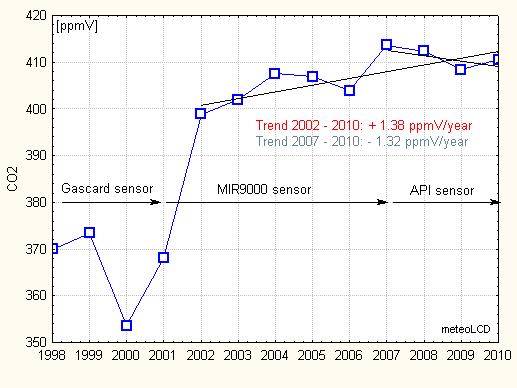
The 1998-2001 data are too unreliable to be retained
for the trend analysis.
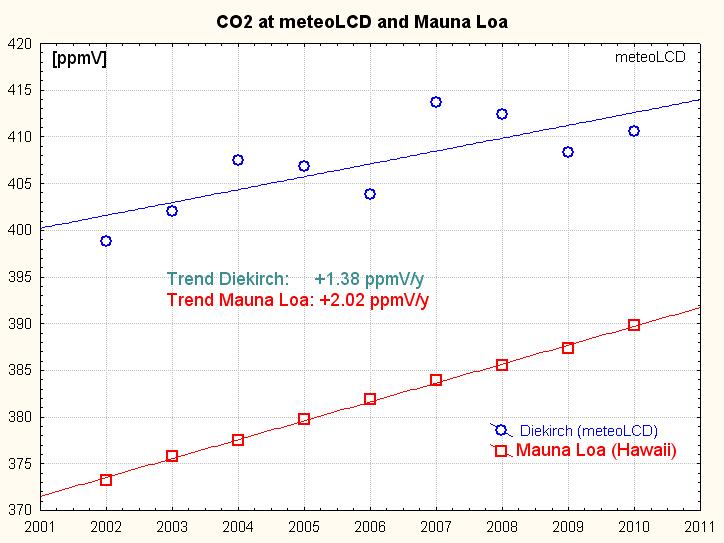
For 2002-2010:
positive trend: + 1.4 ppmV per year
For 2007-2010:
negative trend: -1.32 ppm per year !
mean: 407.1 ppmV
2007 to 2010: 411.2 ppmV
stdev: 4.9
2.3
See this figure
for a comparison between meteoLCD and Mauna Loa CO2 trends.
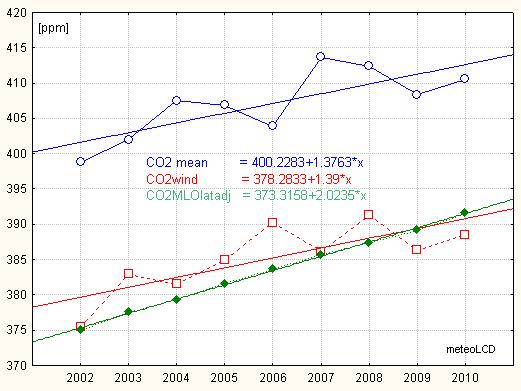
The next picture shows the asymptotic CO2 values
derived from the model published in [21] .
The blue upper curve shows the yearly mean
values at Diekirch; the middle red curve the
asymptotic CO2 values that would exist if wind velocity was infinite, and
the lower green curve the yearly averages at
Mauna Loa, augmented by +1.8 ppm to respect the latitudinal gradient of
approx. 0.06 ppm per degree.
The asymptotic mixing ratios are reasonably close to those of Mauna Loa
(adjusted); the yearly trends calculated from the mean and asymptotic values
at Diekirch are very close (1.38 and 1.39 ppm*y-1). They are
visibly lower than the Mauna Loa yearly gradient.
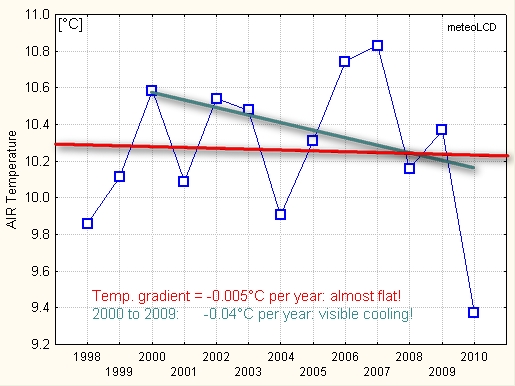
Trend from 1998 to 2010: - 0.005 °C per year
mean : 10.26 °C 2000
to 2010: 10.31°C
stdev: 0.40
0.42
As the sensor has been moved several times, this trend should be taken with caution!
Distinctive cooling from 2000 to 2010:
meteoLCD: - 0.4°C/decade
CRU (Hadcrut3) trend for the past 10 years:
0 0°C/decad. [18]
Highest decadal Central England warming trend from 1691 to 2009:
+1.86°C/decade for 1694-1703!
See also [15]
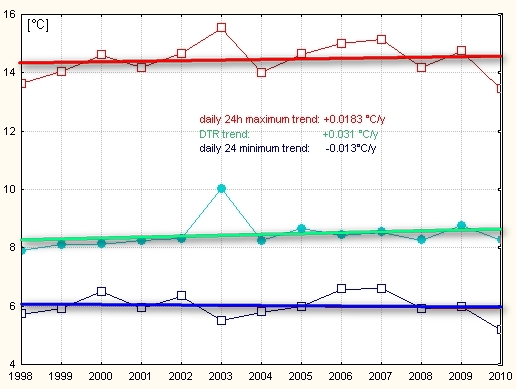
Range (DTR) [°C]
DTR = daily max - daily min temperature
positive trend: + 0.05 °C per year
mean: 8.47 °C
stdev: 0.55
Note that daily maximum rises faster than daily minimum! The increase in
DTR is also documented
here!
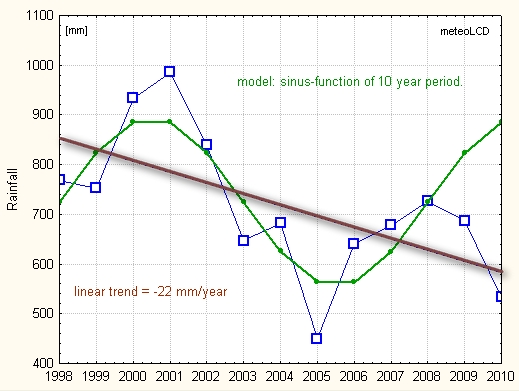
negative trend: - 22 mm per year
mean : 717.4 mm
stdev : 146.5 mm
Rainfall in Diekirch may be very different from that at the Findel airport
!
Findel: NA mm
Note the deviation from the 10 years period sinus fit by a simple sinus
function of period 10 years.
[6] gives medium term periods of 10 to12 years for
the region from England to eastern Germany.
Note: Rainfall readings are possibly too low, as there were several occasions of sensor blocked by bird droppings.
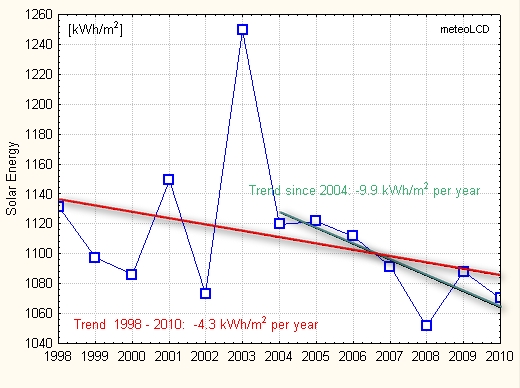
mean: 1097.2 kWhm-2
stdev: 47.9 kWhm-2
Negative trend: -4.3 kWhm-2 per year
and -9.9 kWhm-2y-1 since 2004 (solar cycle #23
terminates December 2008).
This last period should cause a cooling of
0.14 °Cy-1 , assuming a feedback parameter
f =-1 ([19]). The meteoLCD observations show a cooling of
0.06°Cy-1 (from linear regression).
Our data suggest: ΔT =0.053*ΔF
where ΔT = temperature change per year in °C
ΔF = change in solar irradiance per year in Wm-2
assuming solar energy being the sole driver. This is in excellent
agreement with the "fast process sensitivity k1s" given by
Scafetta [20]
[14] finds 0.7 Wm-2y-1
for West-Europe 1994-2003 , meteoLCD +1 Wm-2y-1 for
1998-2003.See also [9]
(derived from pyranometer data by Olivieri's method)
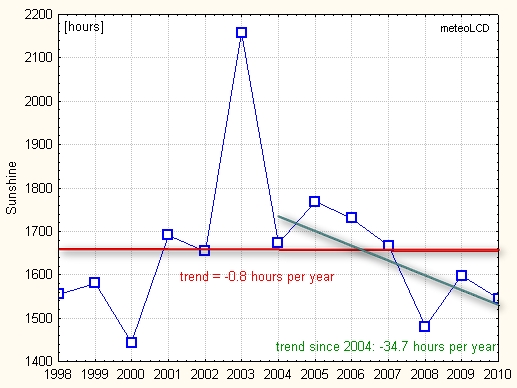
Nearly flat trend: + 0.8 hours per year
mean: 1657 hours
stdev: 178
Note strong negative trend from 2004 to 2010:
- 34.7 hours per year.
Paper by F. Massen comparing 4 different methods to compute sunshine duration from pyranometer readings in the works.
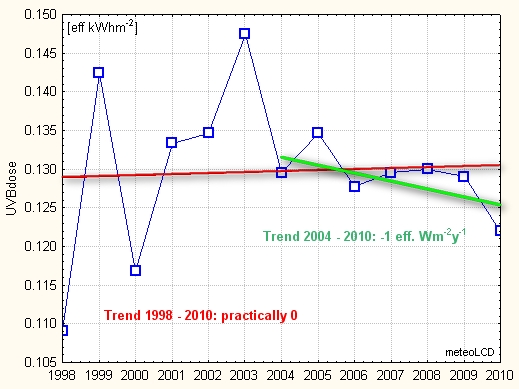
Practically flat trend line for the whole period.
mean: 0.130 eff. kWh*m-2
stdev: 0.010 eff. kWh*m-2
Note negative trend of - 1 eff. Whm-2y-1 from 2004 to 2010,
in accordance to the dimmimg measured by
the pyranometer.
So this dimming is confirmed by 2 independent instruments!
See [10] and [22] (poster finds slight positive trend in June (+2%) and negative trend in August (-1%), no trend for other months, for period 1991 to 2008)
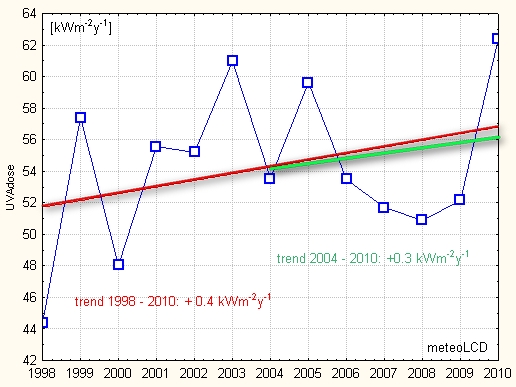
Positive trend: + 0.4 k Whm-2 per year, essentially caused by the first and last readings.
mean: 54 kWh/m2
stdev: 5 kWh/m2
Note exceptional high 2010 reading causing a visible positive trend of +0.3 kWm-2y-1 : This 2010 reading should be taken with caution, as it leads to a trend opposite to that of both the total irradiance and the UVB dose.
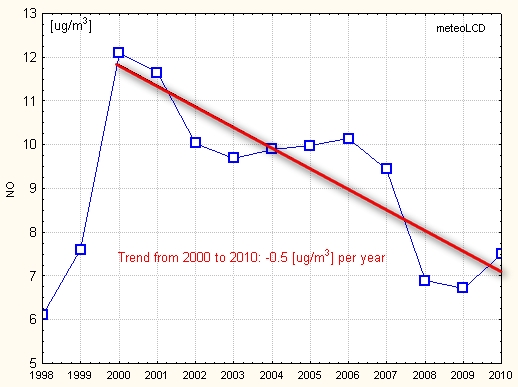
The 1998-1999 data are too unreliable to be retained.
For 2000-2010::
negative trend: -0.5 ug/m3 per year
( = 40% reduction relative to 2000)
mean: 9.5 ug/m3
stdev: 1.8 ug/m3
see [11] which gives ~30% reduction from 1990 to 2005 for the EU-15 countries.
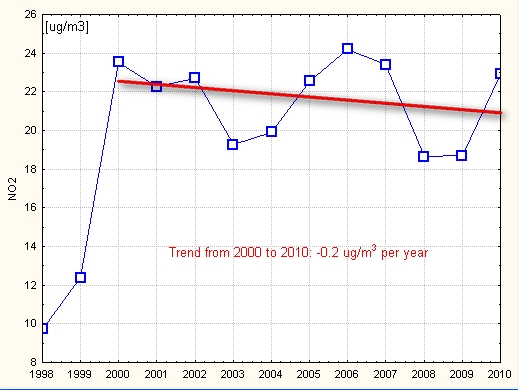
The 1998-1999 data are too unreliable to be retained.
For 2000-2010:
negative trend: - 0.2 ug/m3 per year
mean: 21.6 ug/m3
stdev: 2.1 ug/m3