| 31 Dec 16 |
Made overplot graph of Uccle and meteoLCD total ozone
column measurements for 2016. See "DOBSON"
page. |
| 16 Dec 16 |
Recalibration of CO2 sensor. Zero was offset by 12 ppm.
Multiple checks with zero and span. Seems ok now. |
| 12 Dec 16 |
Recalibration and multiple checks on AC31m (NOx,NO). |
| 10 Dec 16 |
1. Our very, very old and nearly defunct Xmas
lighting has been replaced by a brand-new LED strip (50m wound
around the handrail). Take a look if you are passing by at
night-time!
2. The AC31M NOx sensor causes some serious headaches again:
2a. Controlling all connections, I saw that we registered as
the NO2 signal what in reality was the NOx signal (NO2 = NOx - NO).
Normally the NO2 levels should be lower than the NO. This mistake
goes back for a very long time; I guess since the AC31M was
installed. I will change the GNUPLOT graph to show the three NOx. NO
and NO2 levels, and the channel 16 column of the logger data file
will be re-labeled NOx. All previous yearly Excel files will be
modified by re-labeling and adding a calculated NO2 column. The
trends also must be changed. All this will take some time, so thank
you for your patience
2b. I was unable to correctly recalibrate the AC31M to the
level of our span gas. The shown levels could be too low. This b****y NOx sensor has so many dysfunctions that I
really think on shutting down our NOx measurements. |
| 08 Dec 16 |
1. Maintenance by T.S.E.
2: I changed the dessicant capsules of the UVB and UVA sensors
(disregard spikes in data series). |
| 02 Nov 16 |
There was a temporary problem with the half-hour
transmission between the datalogger and its calling computer at
12:00 UTC. I am not sure why the communication failed, but manual
intervention and a good reboot solved the problem. |
| 01 Nov 16 |
Upload of oct16.dat
into data archive. |
| 30 Oct 16 |
The NO/NO2 sensor remained stuck in Zero mode since
last maintenance from 21 October (my fault :-(( ).Correct
operational mode restarted today at 07:50 UTC.
This long-time zero operation suggests about the same offsets to be
subtracted from the readings as those given below: subtract 3 ug/m3
from the NO readings, and 10 ug/m3 from the NO2 readings. |
| 21 Oct 16 |
Maintenance and calibration. The NO/NO2 measurements
still have uncorrectable zero offfsets, which became sightly smaller
as given in the 25 Sep news. Subtract 3 ug/m3 from the NO and
12 ug/m3 from the NO2 readings. |
| 02 Oct 16 |
Upload of sep16.dat
into data archive |
| 25 Sep 16 |
1. There was a problem with lunar phases in the
smartphone APP; this has been corrected by Marcel Kramer. Thx to Mr.
Zimmer for detecting and reporting this problem.
2. Recalibration of the NO/NO2 sensor: there remains an
uncorrectable problem with the zero offset. The NO readings (as
displayed on the graphs and in the data) are about 4 ug/m3 too high,
the NO2 readings 15 ug/m3 too high. Simply subtract 4 from the NO
and 15 from the NO2 readings; the raw data and the plots will
not be changed, and the plots will continue to represent the raw
data.
3.Recalibration of the CO2 sensor.
4. I bought today on the flea-market hold in the premises of the LCD
an UV-tester for checking banknotes. It comes handy as an UVA source
for quick checks of our UVA Biometer and a small vintage
J-221 photovoltaic UV intensity meter. Photos
here,
here
(outside test) and
here (very
kludgy outside test, sensor protected from sunrays) |
| 16 Sep 16 |
1. Maintenance work by T.S.E. The NOx sensor's main
pump has been replaced, and it will run several days in test-mode to
allow the molybden catalysator regain a normal state.
2. The dessicant capsules of the UVB and UVA sensors have been
refreshed. The sensors were taken off-line for about 1.5 hours.
Ignore the data from 16Sep16 08:30 to 09:30 UTC. |
| 01 Sep 16 |
Upload of aug16.dat
into data archive |
| 15 Aug 16 |
1. As I presumed, the main pump was down, as well as the
NOx sensor; the fault was a tripped fuse. I inspected the pump,
which seems ok. Restart everything at 07:20 UTC. Will have to watch
the future behavior of that pump, as it might be the culprit of the
excess current drawn. Well, after half an hour, the sample indicator
of the CO2 sensor gives a warning, so the pump was dismounted again
and replaced by a new one (which by lucky insight we had among our
spares!). Restart is at 08:20 UTC.
2. Recalibration & maintenance CO2 and O3. The pump of the NOx
sensor is dead (yet another pump!), so no NO and NO2 until the next
maintenance by T.S.E. |
| 11 Aug 16 |
The black series continues..The ground ozone and CO2
levels are much too low, possibly due to a malfunction of the main
pump. Repair is not possible before the 15th August.
added 16 Aug.: the external pump of the NO2 sensor tripped a
fuse, which shut down the main pump. So all CO2 and O3 readings from
02Aug 15:30 to 15Aug should be ignored, as they are too low. |
| 08 Aug 16 |
The NOx sensor is out of order since 02Aug2016 15:30. Please be patient, an
eventual repair can not be made before 7 days. |
| 01 Aug 16 |
Upload of jul16.dat
into data archive. Missing Dobson measurements will follow asap. |
| 13 Jul 16 |
Maintenance and calibration work. |
| 12 Jul 16 |
A new calibration factor of 0.9422 is applied to the
total ozone column Microtops #3012 readings (made by Mike Zimmer)
starting 02Jun2016. A new intercomparison suggests this calibration
factor which replaces the previous of 0.8822. |
| 11 Jul 16 |
From 07:00 to 09:00: the temperature sensitive voltage
amplifier of the main PT100 sensor (AIT, ch.2) has been replaced by
an (expensive) Phoenix Contact MCR model with a 4..20 mA
output and zero and span adjustments potentiometers. Calibration and
verifications have been made using a Bürstner PT100 simulator
auctioned at eBay; this simulator is extremely handy if your
amplifier is adjustable. The data of this morning may contain some
glitches. |
| 01 Jul 16 |
Uploaded June 2016 (jun16.dat)
data into data archive. |
| 21 Jun 16 |
Re-check calibration of AC31M and CO2 sensors. The AC31M
(NO/NO2) still has an uncorrectable zero offset of about + 10 ug/m3
for NO2 and +5 ug/m3 for NO. |
17 Jun
16 |
Maintenance by T.S.E. |
| 11 Jun 16 |
The "Promotion 1968" (i.e. the students who made their
final exam in 1968) met at the LCD, and it was a pleasure for me to
give them a short exposé on climate change titled: "Changement
climatique, pas de panique!" The Powerpoint presentation is
here. |
| 01 Jun 16 |
Uploaded May 2016 (may16.dat)
data into data archive. Due to the change of logger computer,
there are missing data from 03 May 00:00 to 20:30 UTC. |
| 24 May 16 |
RTL TV aired a short video on Al Gore's "An
Inconvenient Truth" 10th anniversary. I make a very short comment at
the end; the video showing some meteoLCD stuff and myself are from
archiv material, as my comment was made through a phone line. See
here
(video courtesy RTL.LU). If your
browser tells you that the file is corrupt and/or does not show any
image, do not believe, but download the video and play it back with
VLC or Quicktime. |
| 18 May 16 |
1. Calibration and maintenance work. The zero bias of
the NO and NO2 readings is confirmed.
2. Restarted the WBGT sensor (even if weather is far from
heat-stressing). |
| 09 May 16 |
1. The NO/NO2 sensors has a positive bias of NO: 1.9 ug/m3
and NO2: 10.6 ug/m3. It has been recalibrated at ~08:00, but
remember that NO readings might be 2 ug/m3 too high, and NO2
readings 11 ug/m3 too high. 2. I had to make some work on the new
HP Thinclients (main logger computer and Davis backup station
computer) --> possible interruption of 1 hour.
3. Today was the day of the rare Mercury transit (planet
Mercury passes in front of the solar disk). As clouds cleared up
after 15:30 local time we (FM and CH) quickly set up an telescope
and tried some pictures.
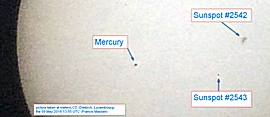
Some more:
photo1,
photo2,
photo3 (I hope I got this right, and did not confuse Mercury and
sunspot :-)).
See
video and
pictogram of path of the transit as seen from near-by Ettelbruck
town. Our photo is among the collection shown at the
timeanddate.com website. |
| 08 May 16 |
The NO/NO2 runs in zero mode for a couple of days, to
get an idea of the zero offset and to reconfigure the molybdenum in
the oven. |
| 04 May 16 |
As predicted, there were some serious problems when
switching to the new HP computer system and a new command-line batch
processing; we started with a cryptic error message from the main
command-line program. Finally the cause was found being a timing
problem between the internal logger operation and the schedule for
retrieving the stored data. Everything seems to be ok since this
morning 05:00 UTC.
The PT100 sensor is now routed through an amplifier mounted
close to the sensor on the terrace. The [0...10V] output
(corresponding to [-50...100 °C] span will travel down to the main
rack, and there goes through a voltage-divider as the logger has a
maximum input of 2V. Reconfiguration of the sensor means that we had
to stop and empty the logger. No data (at least not many) are
lost.... |
| 03 May 16 |
Raoul and I will do some work on the PT100 sensor (we
will add an amplifier) and on the logger computer (which will be
replaced by an exlusively solid-state HP Thinclient running XPe). Be
prepared for some interruption! |
| 01 May 16 |
1. Uploaded April 2016 (apr16.dat)
data into data archive.
2. NO/NO2 sensor again online (operated in forced zero mode for the
last 48 hours after the maintenance by T.S.E. to stabilize the
molybdenum in the oxidation chamber). Ignore the last 7 days values.
NO2 readings seem to have a positive bias of about 11 ug/m3; use
with care. |
| 29 Apr 16 |
1. Repaired Davis Vantage Pro Plus solar radiation
sensor. Humidity sensor is definitely dead, will not be replaced.
2. Maintenance by T.S.E. The NO/NO2 sensor will be go online
probably next Tuesday. |
| 18 Apr 16 |
1. Our lightning computer behaves erratically, and goes
into non-responsive state after a couple of days. I replaced this
morning the old faithful E600 FSC computer by an identical one,
keeping the harddisk and all software from the unhealthy one.
2. I replaced the Weatherlink 5.1. software of the Davis backup
station with version 5.6., which correctly identifies the Vantage
Pro Plus model we are using (that is the original Vantage Pro with
additional total solar and UVB sensors. The HP T5370 thin client
seems to behave very well!
3. A group of "Erasmus" students from various countries
(Iceland, Italy...) visited meteoLCD. Prof. Geneviève Harles manages
this group for a whole week; quite a job! |
| 17 Apr 16 |
Some important changes are on the way. Since a couple
of months the old faithful fanless SUMICOM computers which drive a
lot of our sensors are starting to develop geriatric problems (they
are about 8 years old, and have passive cooling but a traditional
IDE hard-disk). I was looking for a completely passive (nothing
rotating) and inexpensive replacement, and found a rather good
solutions (in my opinion): the HP TT5370 thin client with
embedded XP (XPe). These small computers have 1 GB Ram and 1 GB
flash HD (the older DOC = disk on chip). About 400 MB are available
for usage, after the system and a couple of programs are installed.
That's not much, but enough for the single job to be done plus
Automate scheduler plus TightVNC). What shines is that all software
is still available at HP, and that cloning a machine on an USB stick
is very easy (restoring is by booting this stick). Also all
traditional sockets (PS2, serial, VGA) that we still need are
available.
Our backup Vantage Pro Plus station was down since a couple of days,
so I started with this to install the first T5730. This has been
done yesterday: if you click on the "live-data" page to
Backup -current what you see will come from the thin client (the
humidity and solar irradiation sensors are dead; no repair planned
in the near future).
The next replacement will be the main computer communicating with
the datalogger. I ran 3 weeks of tests at home, and everything seems
pretty reliable... |
| 09 Apr 16 |
Cheers to Raoul who has managed to bring the system
back to correct working... I do not yet have the details... 13:59
UTC: Raoul says the culprit was a flaky LAN patch cable... How bad
that such small things can create as much havoc! (well, an atomic
bomb also needs just a small neutron source to go off, and NASA
mistaking inch for meters....) |
| 08 Apr 16 |
Malfunction: The
transfers from the datalogger to the other computers and the upload
to the webserver are down. I am unable to restart from abroad...
Raoul Tholl will check the problem asap... please be patient!
17:19 UTC: Raoul tried his best to bring back to
proper working the datalogger computer... but it remains unreachable
over the Lan. Possibly the Lan interface is defunct.... Watch the
NEWS tomorrow. |
| 01 Apr 16 |
Uploaded March 2016 (mar16.dat)
data into data archive. |
| 24 Mar 16 |
The pump that went bad tripped a fuse, which powered
down the main switch of the meteoLCD LAN. This stopped transmission
to the webserver yesterday from 11:30 on. "Repaired" today at 08:00.
This did not hold; NOx sensor shutdown until next maintenance by
T.S.E. |
| 23 Mar 16 |
The big external pump of the AC31M instrument (NO/NO2)
was blocked (probably since 19/03). The inbuilt fan is broken, and
the bearings seem in bad shape. As a quick repair, I de-gripped with
MOS2 oil and added an external fan for cooling. Sensor restarted at
10:06 UTC. The pump will be replaced at the next major TSE overhaul
in April. 16:00: The pump seems to be definitively broken. The NOx
sensor will be shut down for the next couple of weeks. |
| 20 Mar 16 |
The COM port problem showed up again 3 days ago; I
replaced the computer by a spare yesterday, but no luck: problem
again this morning!. As the problem is cured usually by a cold
reboot (actually a power cycle of the computer), I inserted today (
at 16:45 UTC) a software reboot at every hour xx:15. Not sure if
this helps.... |
| 12 Mar 16 |
The intermittent COM port problem has shown up again
two times, the last yesterday. I have restarted the system and
will try to find a solution tomorrow. |
| 05 Mar 16 |
The computer making the half-hour transfers from the
datalogger and forwarding the data to the Linux machine which
creates the plots and uploads everything to the webserver, stopped
working properly the 4th March at 04:00 UTC. The problem was that
the old Win2k did not release the COM port used to access the
datalogger. This is a rare problem, that happened before, and I am
not sure about the real cause. It could be a timing problem in the
AUTOMATE script which commands all the automatic stuff. Just to be
sure I doubled a wait pause in the script... To bring back the
computer to correct action one must power it down and up, a simple
restart does not help. This was done today at 07:17 UTC. |
| 01 Mar 16 |
1. I have changed the wrong date of all relevant files (today.dat,
7days.dat, all.dat), reset the logger's date to 01 Mar after a
complete download, emptied the logger memory and restarted the
logger at 08:00 UTC. As promised. no data have been lost... and the
live plots are ok.
2. February data (feb16.dat)
uploaded into data archive
3. Updated CO2 section in the "Trends" chapter; there were a couple
of glitches (error in the regression lines equations) |
| 29 Feb 16 |
Our old but reliable datalogger can not handle leap
years; so the ASCII file you might download show today the date of
01th March. This problem will be handled tomorrow with a full
download of the logger and a reset of the date to the correct day.
With a bit of care no data will be lost. |
| 06 Feb 16 |
Ultrasonic anemometer seems dubious. Plots will use old
analog anemometer readings starting today 19:00 UTC |
| 01 Feb 16 |
Upload of January data (jan16.dat)
into data archive. |
| 24 Jan 16 |
1. Calibration and maintenance work on all sensors
2.The trend analysis for 2015 is done. Please look
here! |
| 22 Jan 16 |
The NO/NO2 sensor AC31M is back and was
restarted today at 10:00. The repair by T.S.E. was difficult and
needed quite a lot of skill, as it had to be done with spare parts
and at low cost, because meteoLCD would have been incapable to pay
the price of a "standard" repair procedure. The peak in CO2 levels
is not natural, but caused by human respiration during the
installation and launching of the repaired sensor! |
| 14 Jan 16 |
I finished a comparison between our total ozone column
measurements made with the Microtops instruments and the Brewer #178
measurements made in Uccle. See the graph
here. Our measurements are surprisingly good compared to the
very big and expensive Brewer. Many thanks to Dr. Hugo de Backer,
the director of
meteo.be, for providing the missing Uccle data series. |
| 07 Jan 16 |
I started the update of the
trends section
today. Even with computers, this is a major work, so the update is
an action in progress and will take some time to finish. |
05 Jan
16 |
Upload of
2015_only.xls file with all 2015 data and statistics. This
file contains also daily and monthly summaries and some comparisons
with FINDEL data. Also upload of
meteolcdstats_1998_2015.xls |
| 02 Jan 16 |
1. Upload of dec15.dat into data archive
2. Created 2015.zip file of all monthly data files and added to
archive. |
| 01 Jan 16 |
1. The usual dogs-dinner in the 7days plot due to Gnuplot
problems with handling previous and new year (the logger files do
not contain the year number). This will be self
healing in the the next 7 days.
2. Added
overplot of Uccle and Diekirch total ozone column
measurements for 2015 (see Dobson page) |