22
Dec
21 |
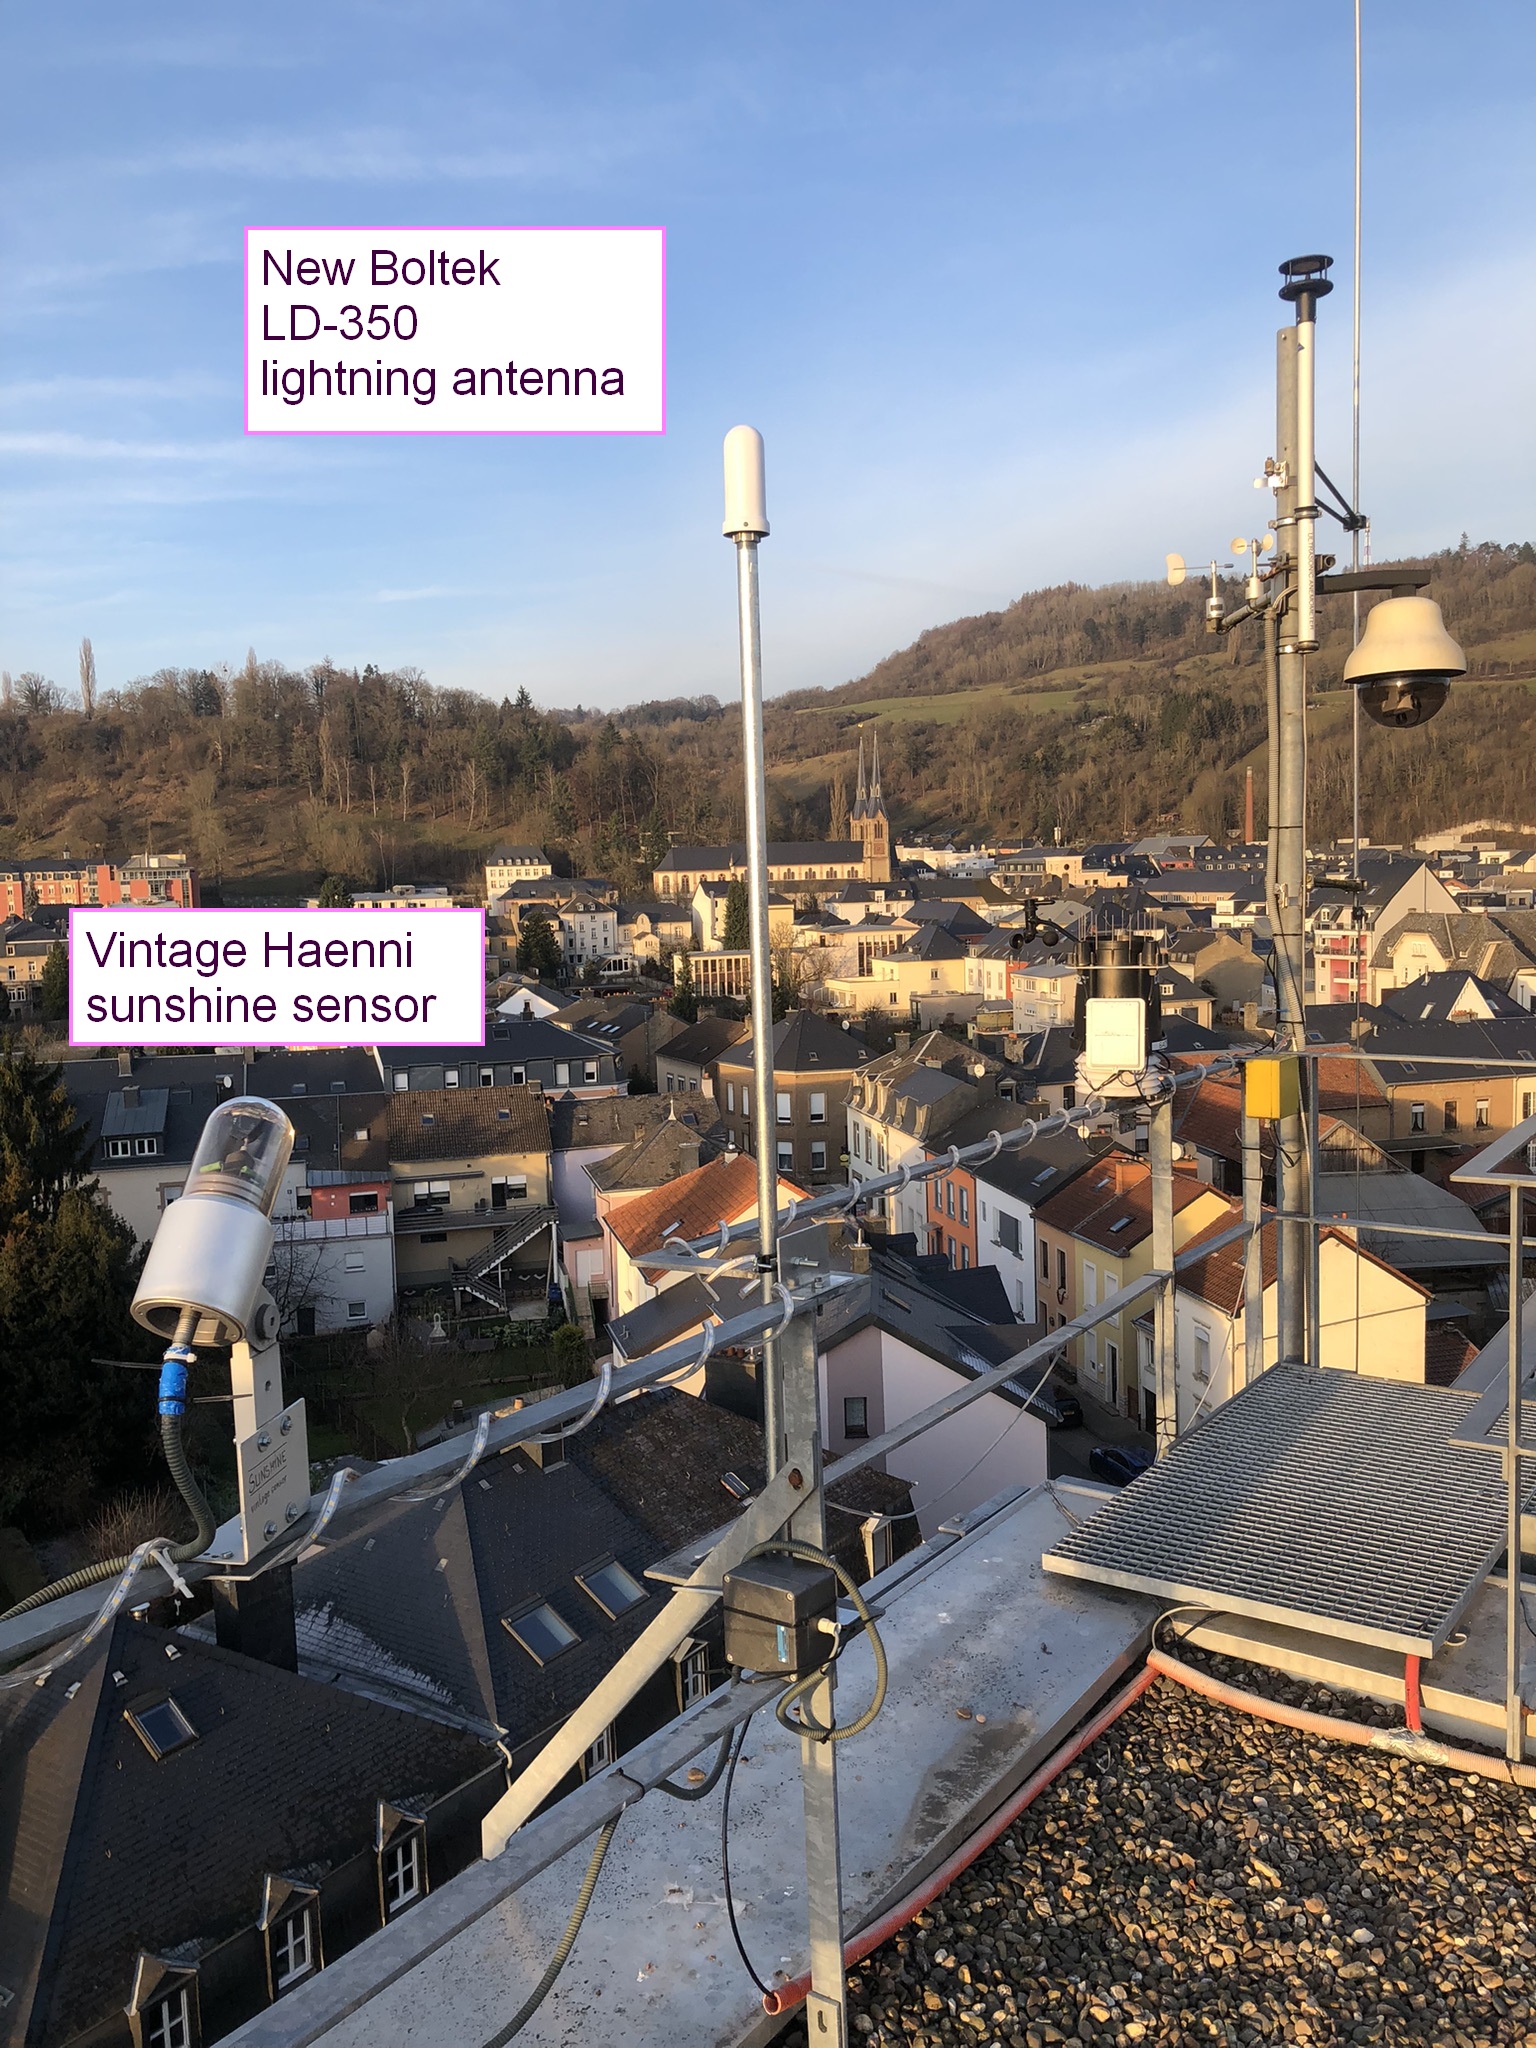
Raoul Tholl and myself installed a new lightning sensor, the Boltek
LD-350. This is an USB device, and the Astrogenix Nexstorm software
runs now on an HP t610 thin client (fanless, flash memory). The
antenna is a new design, and we replaced the old cabling by a new
one. During the next days, some adjustments have to be made to the
squelch, as the antenna is very sensitive to electromagnetic noise. |
01
Dec
21 |
Uploaded November 2021 data (nov21.dat)
into data archive. |
11
Nov
21 |
1. there was an electrical security problem with the
new LED ribbon: leakage at the terminal cap. I installed a really
waterproof case for this end.
2. The Sky camera did not respond since about mid-October. Reason
unknown. Power-cycle + contact cleaning cured the problem.
3. Shut off for 1 hour of the UVA sensor, whose internal temperature
regulation is flaky. Cleaned contacts, repowered...ok now. |
10
Nov
21 |
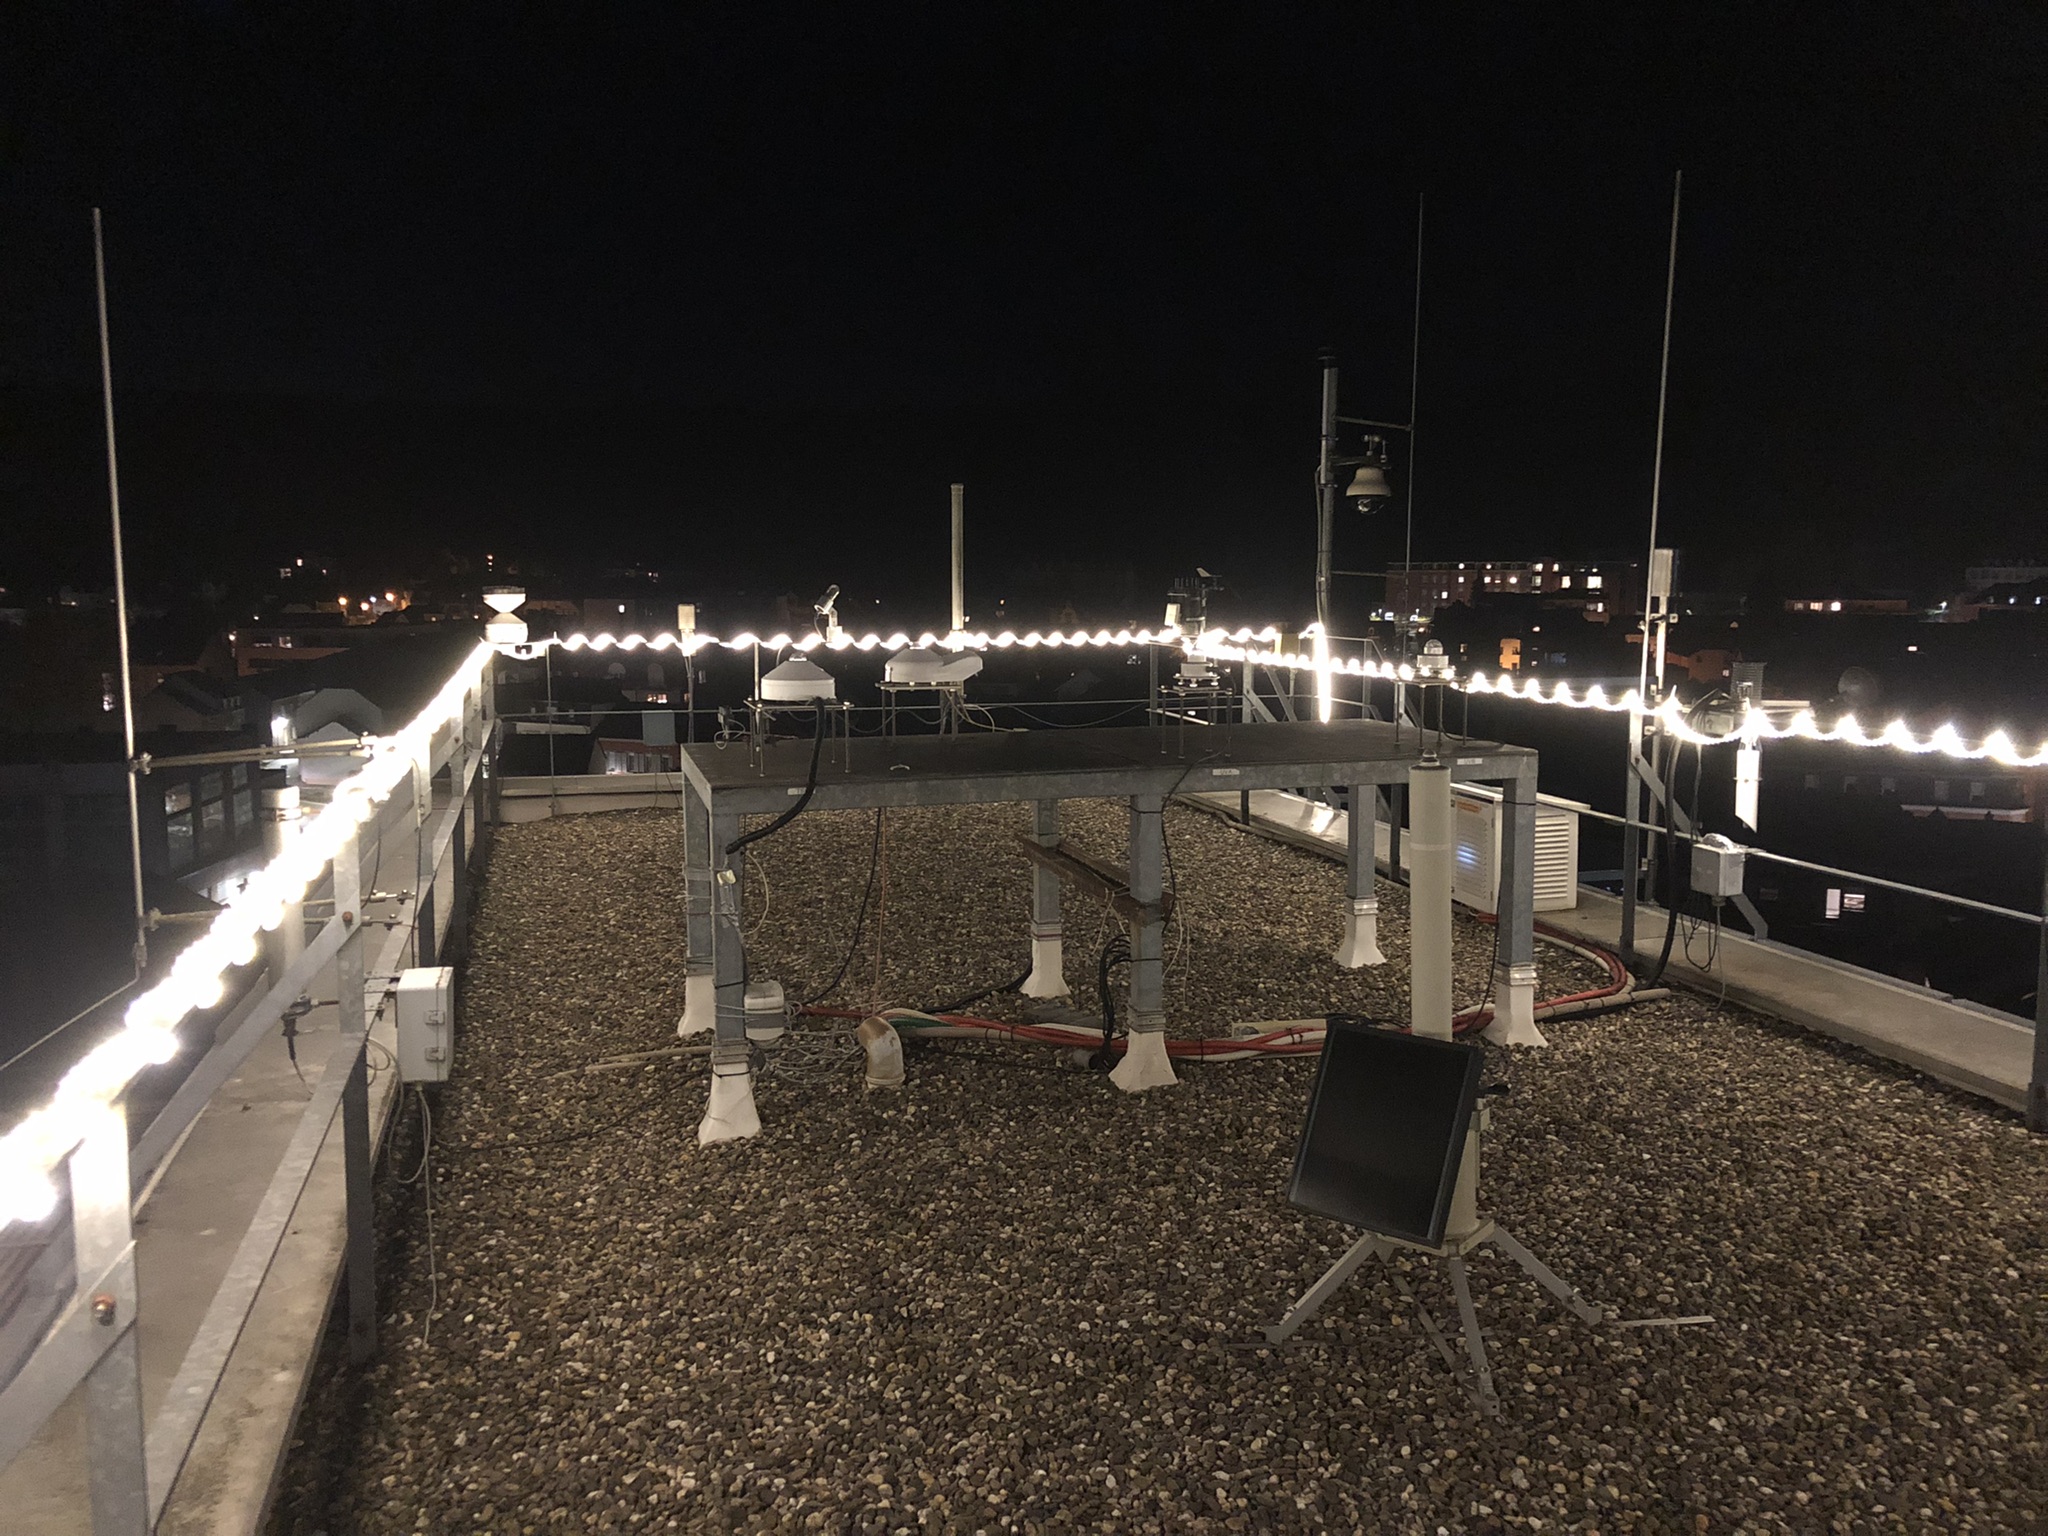
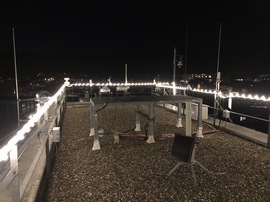
Florence Massen and myself replaced our old Christmas lightning,
which was in a really bad shape after many, many years in action, by
a new LED string; today it was switched on and will hopefully
improve the mood of the universe!
 |
07
Nov
21 |
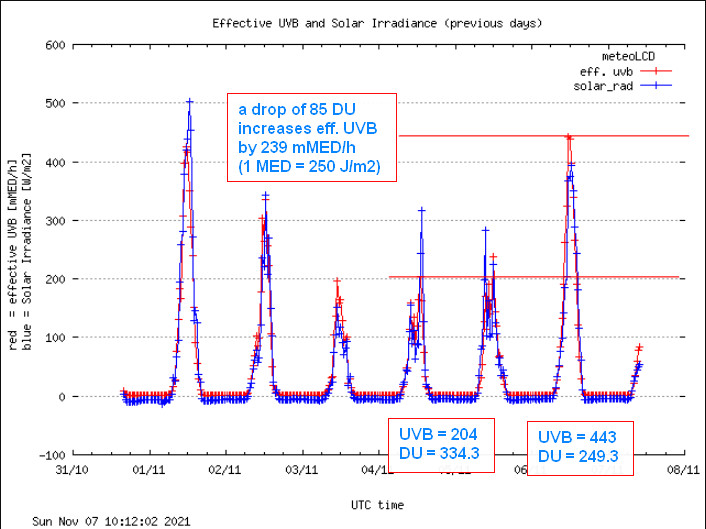
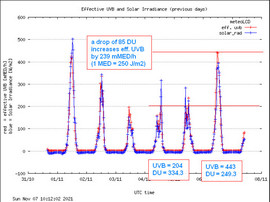
Again a beautiful illustration how a sudden drop in TOC (total ozone
column) increases UVB radiation at ground-level. Here we compare the
situation on the 4th and 6th November 2021:
 |
01
Nov
21 |
Uploaded October 2021 data (oct21.dat)
into data archive. |
15
Oct
21 |
The history of over 25 years operation of meteoLCD has been
published in the 2021 year book of the Lycée classique Diekirch.
Written by Francis Massen in French, it is titled "meteoLCD:
25 ans de mesures et de présence climatologiques".
Click on the title to download a PDF version. |
06
Oct
21 |
The WBGT sensor has been shut down (the Wet Bulb thermometer will
not have its cooling water renewed); clicking on the icons will
nevertheless show all 3 signals, but please remember that the Wet
Bulb readings correspond to a "normal" air-thermometer readings. |
02
Oct
21 |
Uploaded September 2021 data (sep21.dat)
into data archive. |
01
Sep
21 |
Uploaded August 2021 data (aug21.dat)
into data archive. |
04
Aug
21 |
The lightning computer is out of order. Not sure if this can be
repaired asap. Please use link to excellent site blitzortung.org as
a replacement. |
01
Aug
21 |
Uploaded July 2021 data (jul21.dat)
into data archive. |
24
Jul
21 |
From the 17th to 19th July we had a problem with the Globe
Temperature sensor of the WBGT assembly. Raoul Tholl looked after
the problem, which was a contact problem in a switch box. Things are
back to normal from the 20th July on. |
06
Jul
21 |
A class of 16 older students (second last class of the lycée
LTPS Ettelbruck) visited with its professor Raoul Tholl meteoLCD
(and the Computarium). We made a guided tour over the terrace,
explaining the different instruments, showing the computers driving
the station and gave some thoughts on the question of climate change
problem. |
01
Jul
21 |
Uploaded June 2021 data (jun21.dat)
into data archive. |
23
Jun
21 |
Yesterday there was a precipitation event: our usual rain sensor
missed several mm (compare its reading with those of the Davis
backup station). The culprit was not bird droppings (my wire mesh
seems to deter!) but some dust and a too narrow tube outlet above
the tipping bucket. I slightly enlarged the opening with a sturdy
Teflon tube... let's hope this will cure the problem. The
rainfall shown today (before 11:00 UTC is more or less the quantity
missed yesterday, so the monthly total should approx. be correct. |
20
Jun
21 |
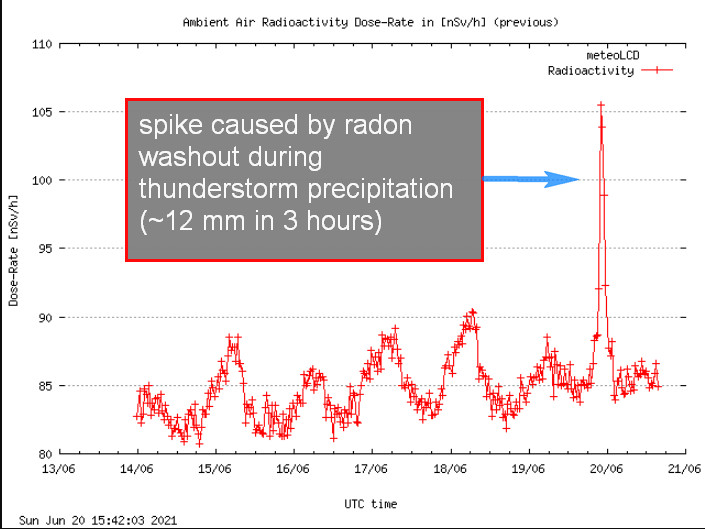
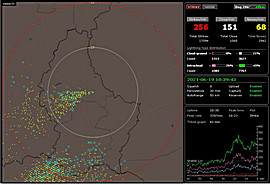
Yesterday (19th June) we had the first serious thunderstorm starting
about 18:00 UTC. Click on the picture for an animation showing a
couple of screen-shots starting 18:39 and ending after 20:59. The
bluish crosses are the new impacts, and the yellow dots the previous
ones (with some noise). Clearly the storm moved from south-West to
North-East. So the reinstalled old antenna seems to be ok for the
moment.
Click also on the following picture that shows nicely the effect of
radon washout (and peak in air radioactivity) caused by the
thunderstorm rainfall (about 12mm in 3 hours):
 |
15
Jun
21 |
Renewed wick of the WBGT sensor; sprayed black globe with black
color, added one more distilled water pumping at 16:00 UTC to avoid
wick drying during the late afternoon hours. Checks show that 3
daily pumping sequences each of 1 minute is sufficient (08:00,
12:00, 16:00 UTC). This gives an autonomy of more than 2 months per
canister of demineralized water. |
13
Jun
21 |
I spent my Sunday afternoon downloading the Haenni Solar
sunshine-hours data, and tried to find the fault of the Boltek
lightning detection system. Finally the culprit is the latest
(active) antenna which was installed last year, and which now was
stone-dead. I reinstalled the previous one, and checked if it
detected electromagnetic noise (using an old computer). This older
antenna nicely showed up this noise (what the other didn't do). So
we just have to wait for a good thunderstorm... I am musing on
replacing the antique Boltek Stormtracker system (which is built on
a PCI-card) with the latest LD-350 model (USB model). It's a bit
pricey, so we must see if our remaining budget can eventually tackle
this. |
09
Jun
21 |
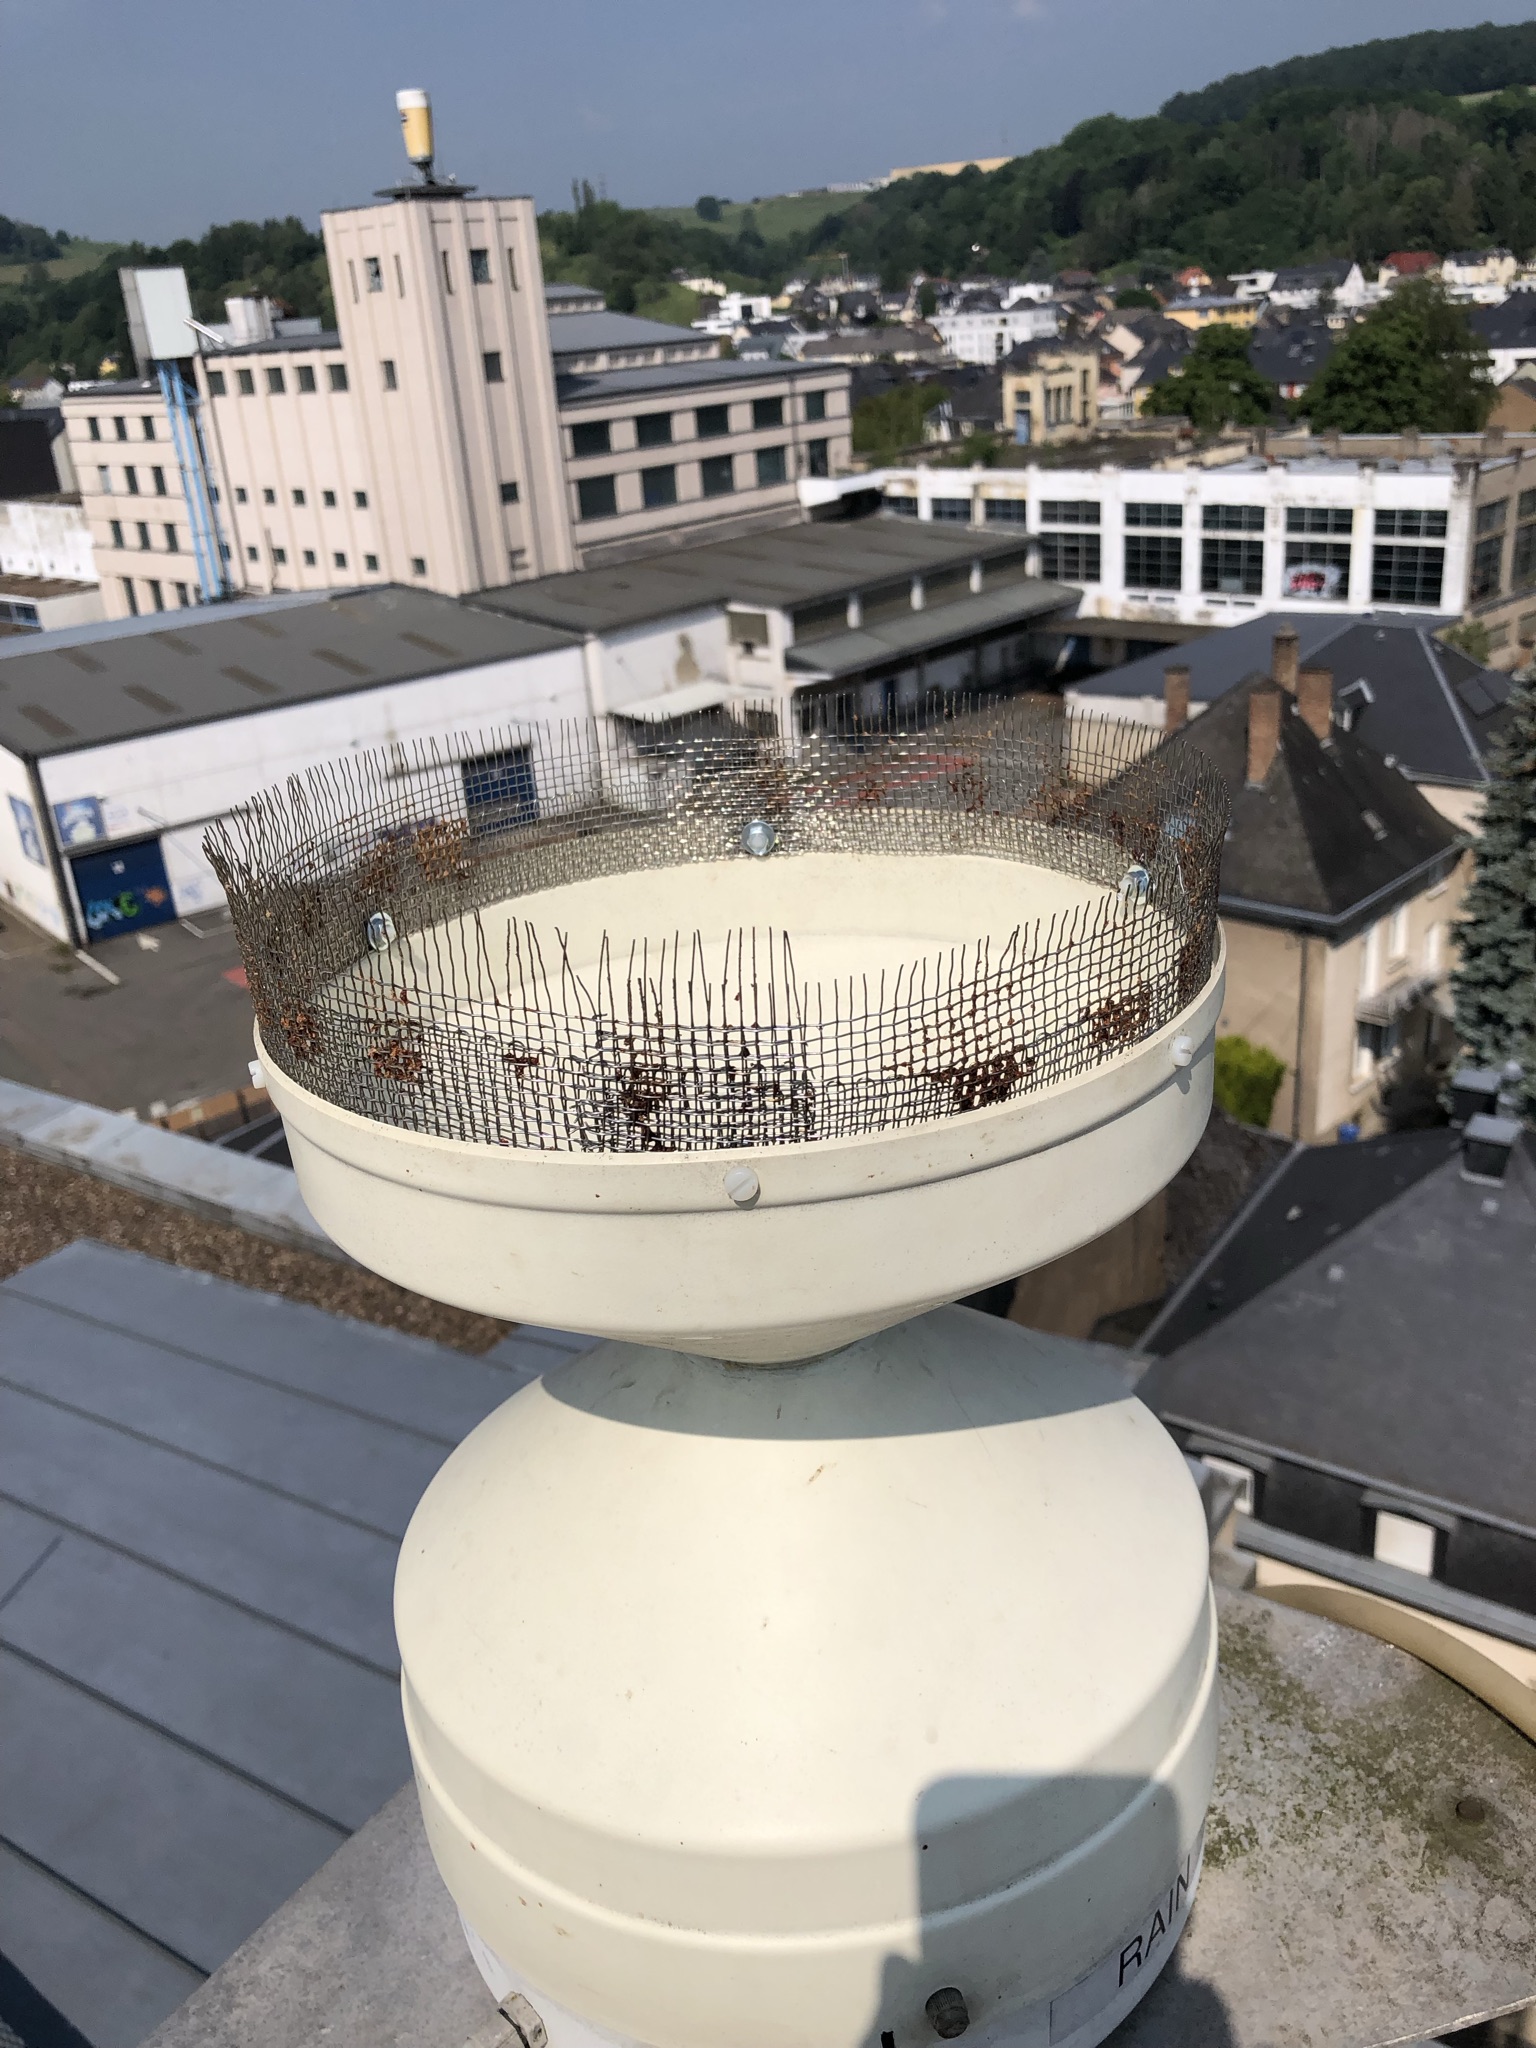
1. My colleague Frank Thillen gave me a piece of INOX wiremesh (from
his bee-hives), and I added sort of a bird-deterrent to the
rain-gauge. If the future shows that this mesh blocks too much of
the precipitation, it is easy to shorten and/or reduce the number of
spikes. Let's hope that the birds will be scared!

2. The lightning sensor is out of order. Reason unknown for the
moment. |
08
Jun
21 |
1. The "old" Cairsens O3&NO2 sensor has
been removed and replaced by a new model, which will be
good for a year without calibration. The conversion factor in the
logger has been reset to the default; a comparison with the
Beckerich station over the next weeks will tell if these defaults
can be kept or will have to be modified. Start of the new sensor is
today 07:00 UTC. I want to recall that we take the combined readings
of O3&NO2 as "pure" O3, as the NO2 levels are nearly always below
the detection limit of 40 ug/m3 (there is no pure O3 sensor
available in the Cairsens line). The O3 calibration certificate of
the new sensor shows a very good linearity with 4 ppb Ref <--> 6.67
ppb Cairsens and 180 ppb Ref <--> 182.98 ppb Cairsens (Ref is the
O342M 27 snesor). We use the conversion factor of 1 ppb = 2 ug/m3.
2. The Rain sensor was again blocked by bird droppings; I allowed
the accumulated rain drip down, so to have at least an approximate
correct total for the last week. But pay attention to the fact that
the shon precipitation today is an artefact. Best is to look the
readings of the Davis Backup station for these missing days.
3. The SPM10 Kipp&Zonen solar sensor (ch.6) has since a few
month some humidity droplets under the outer quartz dome. I opened
the sensor cleaned this, but there remains also a slight
condensation on the inner dome, which I am unable to open. I should
compare the readings of this sensor with those of the old CM21
(ch.23) which is still active; it has a dessicant capsule I replaced
today. |
01
Jun
21 |
Uploaded May 2021 data (may21.dat)
into data archive. |
18
May
21 |
The Linux computer doing the full work stopped working today at
00:30, for reasons unknown. Relaunched at 14:00 UTC. |
11
May
21 |
The WBGT (heat-stress) equipment has been reactivated for this
year. Well, the temperatures are still far from being stressful,
but who knows, the meteorological situation may change fast! |
01
May
21 |
Uploaded April 2021 data (apr21.dat)
into data archive. |
29
Apr
21 |
New article in the BLOG on computing the Radiation Amplification
Factor RAF from 5 cloudless days in April 2021. No great changes
from previously found values! |
02
Apr
21 |
1. Uploaded March 2021 data (mar21.dat)
into data archive.
2. There was still a problem with the calibration function of the
CAIRSENS. This has been corrected and display of readings will
resume soon this afternoon. |
31
Mar
21 |
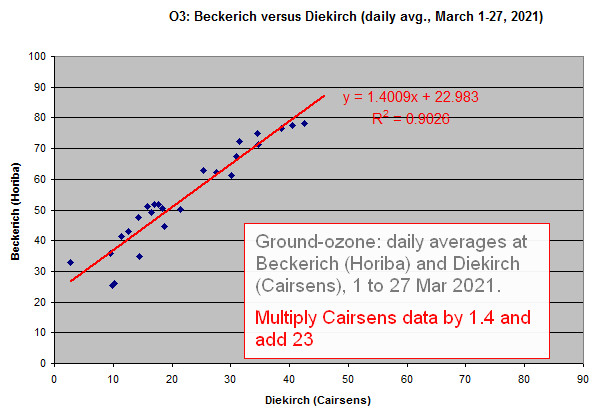
I am not too happy with our ground-ozone measurements made by the
Cairsens instrument. From start on there was a big difference with
our "reference" station of Beckerich, and at least during 2021 a
huge bias showed up in the calibration curve: the Cairsens readings
have a negative bias and a too small amplitude. The following
graph shows the daily averages fro 1 to 27 March 2021. It suggests
to apply a multiplier of 1.4 and an offset of 23 to the readings
stored.
The 1th July 2020 we introduced the following formula to adjust
the Cairsens readings to Beckerich:
Diekirch_adj. = Diekirch/0.9311 - 36.309, which is programmed
into the datalogger.
This will be changed tomorrow to Diekirch_adj. = Diekirch/0.6651
- 27.8
The Cairsens sensor in activity is the second in our line, and I
was very satisfied with the first. The second, despite a good
calibration certificate, did not behave well. It will be replaced in
May 2021. |
12
Mar
21 |
Ok, all is well now with the Airvisual Pro and the PM 2.5 data on
the cloud! |
11
Mar
21 |
The problem with the data transmission of the Airvisual PM sensor is
still not solved; the data are correctly transmitted into my
(private) dashboard on the iQAIR cloud, but not updated on the
public website. This could be a configuration problem of iQAIR, with
a glitch made when changing form one device to another. |
05
Mar
21 |
1. Filter of Cairsens O3 sensor replaced; this explains the sharp
dip around 08:00 UTC. Readings have a bias of about 10 -ug/m3 w.r.
to Beckerich, so are distinctly to low. I will wait for a week for
the new filter to become fully active, and will redo a calibration
control with Beckerich thereafter.
2. The old Airvisual PM sensor (Air Quality) has been replaced after
2.5 years of activity by a new one, same model (called METEOLCD2).
iQAIR has forgooten to think that a replacement is an option, so I
have to go to the full sequence for bringing the new model back into
the cloud. So the new data will not be avaible for some time on the
live-data link. I wrote to iQAIR about this, possibly this will make
this a bit speedier! |
02
Mar
21 |
Upload February 2021 data (feb21.dat)
to archive. |
05
Feb
21 |
Update of "Trends"
chapter to include 2020 data finished. |
01
Feb
21 |
Upload January 2021 data (jan21.dat)
to archive. |
06
Jan
21 |
I started updating the "Trends"
section. This is work in progress, and demands a lot of time.. so
please be patient! |
03
Jan
21 |
1. The big Excel file (2020_only.xls)
has been uploaded into the data archive. It holds all readings and
daily's and monthly's averages, together with several results from
the Findel meteo station (Metolux).
Yes I know that .xls is passé, but I remain faithful (most of the
time) to the 2003 Excel version, and all the newer .xlsx versions
can read these vintage files.2. The 7days graphs are still bad...
best is to be patient until next Friday. |
01
Jan
21 |
1.
Our old faithful Delta_T datalogger does not store the year count in its
data-time column, so there usually is a mess with the Gnuplot 7-days
plots during the first week. I intervened manually to cut off the
last December 2020 days; this means that the 7 days plot wil first
show only 1, than 2, 3..., up to 7 days during the ongoing week.
This hopefully will get rid of the usual dogs-dinner plots for
the next days... 2. Upload December 2020 data (dec20.dat)
into data archive
|