17
Dec
22 |
We have a serious problem with the computer driving the data
logger; it stopped working for no apparent reasons (yesterday
16Dec2022, 18:00 UTC), and booting up was unsuccessful. As one
incident never comes alone, the backup computer was dead... but I
could reanimate it by removing the and reinserting the BIOS battery.
The original computer is now back in action, and we will see how
this works out. These are HP t5730 thin clients running XPe; all our
other thin clients are more modern (!) t610 models running Win7e. I
guess we should migrate entirely to these t610 with Win7e, if the
software for interrogating the Delta-T logger and the Automate still
run ok. The t610 clients are easier to back up to an USB image, and
to restore from that image. A busy future, again... |
16
Dec
22 |
AQI_Air_Quality_Confusion.
I assembled the 5 parts of the blog posts into 1 single PDF.
|
15
Dec
22 |
1.
I had to shut down this morning (ca. 08:00 UTC) the equipment for
about 1 hour, because a bad UPS battery had to be replaced. There
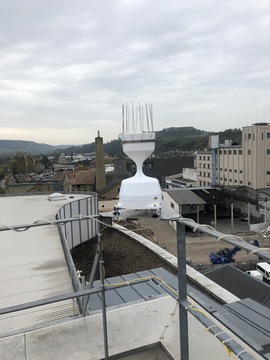
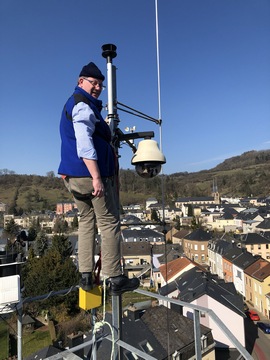
may be some spikes in the graphs. 2. This morning there was very
cold, but sunny weather, so I made some pictures of our equipment
and some views from the terrace:
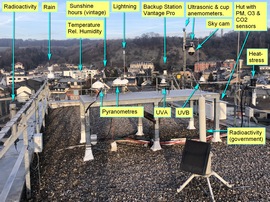 |
A view on all our outside equipment, state 15 Dec 2022 |
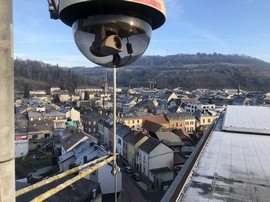 |
Sky cam and part of Diekirch in the background |
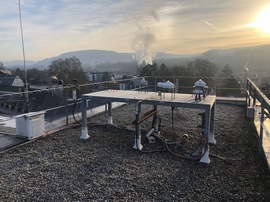 |
Table with solar sensors; city heating produces white
water vapour columns |
|
04
Dec
22 |
Upload nov22.dat to data
archive. No data have been lost by the malfeasance related below. |
04
Nov
22 |
I goofed at the last upload of monthly data; as the transfer time
from the logger was quite long, I stopped the automatically running
processes, and forgot to re-enable them. My face is
red! The fault has been removed
today at 18:15. |
01
Nov
22 |
Upload oct22.dat to data
archive. |
29
Oct
22 |
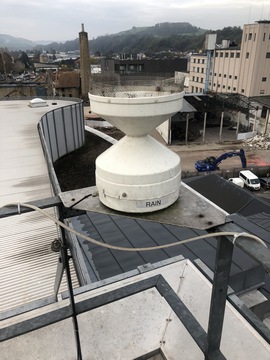
I replaced the old end-of-life Delta-T raingauge by a new ARG314,
bought from UP GmbH (Germany). Fitting the new sensor to the base
was some work, but starting at 11:00 UTC it is now active. The 2
pictures show at the left the old gauge, with its makeshift
bird-protection, and at the right the new sensor with the optional
bird scare crown. This protection is an absolute must, as the many
birds around meteoLCD consider the raingauge as being sort of a
bird-loo, and their droppings quickly block the outlet channel to
the tipping buckets. The new sensor has the same sensitivity as the
old one: one bucket is 0.2mm precipitation (actually 0.197mm, but we
will take this as 0.2mm). The bird spikes are not beautiful, but
hopefully they will do their job and scare these flying
shit-throwers away!
|
25
Oct
22 |
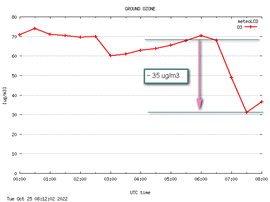
The CAIRSENS O3&NO2 sensor
has been replaced by a new one (#10990) at 07:00 UTC. Since a
couple of months I was aware that the old model (#8454) measured too
high , at least compared to the reference station of Beckerich. The
new one shows a plunge of about 35 ug/m3, but this should not be
seen as definitive, as the filter and measuring cell takes several
days to adjust to its full sensitivity. This problem will be
followed...
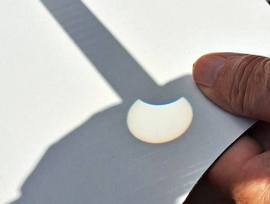
2. There was a partial solar eclipse today; here a picture taken
close to the maximum (~12:00 local time):
|
12
Oct
22 |
1.
The WBGT system has been shut down until next season (May
2023). If you click on the "sensor shutdown" icons, you will see the
plots of the 3 thermometers, but the WetBulb sensor runs now dry, so
it's readings should be very close to the DryBulb.
2. The rain sensor was completely blocked, and the water
stood high in the trough; I tried to not loose any precipitation, so
that all this water is counted now as one (fake) monster peak. The
aim was to keep the total yearly count more or less ok. You might
also see this yearly total on the Davis Backup station (reads 384.2
mm) |
01
Oct
22 |
Upload sep22.dat to data
archive. |
01
Sep
22 |
Upload aug22.dat to data
archive. |
31
Aug
22 |
See here the research score of Francis Massen:
https://www.researchgate.net/profile/Francis-Massen/stats My
colleagues and friends have much contributed to this work, mostly
touching climate/meteorological problems. |
01
Aug
22 |
Upload jul22.dat to data
archive. |
02
Jul
22 |
Upload jun22.dat to data
archive. |
20
Jun
22 |
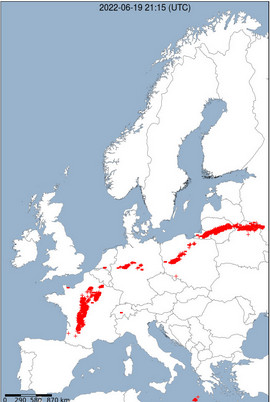
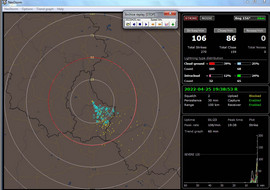
We had our second lightning storm for 2022 this night; it was much heavier
than the first from 25th April. The Boltek LD-350 worked fine:
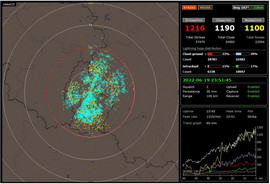
Here what EUCLID shows 2 hours before: note the arc going form
France over Luxembourg into Germany...
... and here BLITZORTUNG close to midnight UTC ( = 02:00 local time,
20th June):
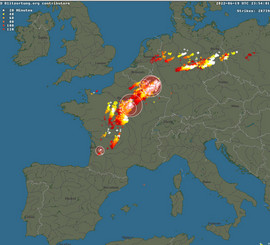
Click
HERE for full video of Nexstorm archive covering the
period 19June 22:19 to 20June 09:20 (all UTC times, for local time
add +2h) |
02
Jun
22 |
Upload may22.dat to data
archive. |
07
May
22 |
WBGT sensor restarted today at 09:00 UTC. Watch how the web
bulb temperature changes as the humidified PT100 sensor inside the
wick starts to loose heat by evaporation. |
01
May
22 |
Upload apr22.dat to data
archive.
New CMP11 pyranometer at CH.6. The calibration (by comparing to the
CM11) is still preliminary; it will be updated if more data are
available. |
29
Apr
22 |
I wrote the 18th April that our SMP10 pyranometer will not be
repaired; I also refuse to buy a new model, when clearly Kipp &
Zonen tells that the dessicant inside the SMP10 is good for 10
years, and ours did not avoid water vapour condensation after 6
years! So I auctioned at eBAY a second hand CMP11 model,
which has the old tried and working dessicant capsule, to be
replaced every 3 or 4 months. The CMP11 is installed in the same
ventilation unit as was the SMP10, and I use a Vernier Instrument
amplifier to push the mV voltages up into a 0..2000mV range (which
is the range of our Delta_T logger). It was quite a work to route
the new cable through a duct that is practically fully occupied. The
logger engineering factor was slightly changed from its theoretical
value to yield practically the same reading as the CM21; as the day
was very hazy, this possibly will have to be redone under full sun
conditions. The plot of solar irradiance still shows the CM21
readings; the new CMP11 data are in column #6 titled ESR Solarkip of
the today.dat or 7days.dat files. |
25
Apr
22 |
We had the first thunderstorm for this year (it was a real tiny one), and
this was also the first registered by the new Boltek equipment. Click on
the picture to emlarge:
 |
18
Apr
22 |
1. Even if our WBGT heat stress sensor is not yet operational (i.e.
the wet bulb is not wetted by distilled water) the 3 temperature
sensors are working (just click on the icon with the text "not
measured"). A couple of days the GLOBE_T sensor went bad (as it did
last year). This time, the culprit was not a bad contact on one of
the outside connectors, but a bad contact on the screw terminal of
the datalogger. This has been "repaired" today at 07:30 UTC
2. The all.dat file ("all data from last logger restart") became
very big, covering more than 3 years of raw data. It has been edited
to start now at the 01JAN2021. When usung these raw data files,
remeber that our logger does not handle leap years. In a leap year
the 29th February is simply a copy of the 28 February.
3. The SMP10 pyranometer from Kipp&Zonen should not need any
dessicant for 10 years. Many months ago some droplets appeared at
the outer and also the inner dome. I removed the outer dome, cleaned
it, but the problem showed up again. Kipp&Zonen refuses to
acknowledge the problem, puts all the blame on me and says a repair
will be more expensive than a new device. I will not buy another of
these expensive pyranometers (about 2000 Euro); we will use the old
and very robust CM21, and either reuse the bad SMP10 just for
comparison, or buy a second hand pyranometer as a replacement. I am
quite upset on this; I should have contacted Kipp&Zonen before the
end of the 5 year warranty (we bought the SMP10 in 2015) and
returned it at the slightest suspect condensation... |
06
Apr
22 |
There was an interruption in the plots for the last 6 days. I am not
sure about the cause. No data are lost (thx to our datalogger!).
Everything seems coming together again today in the afternoon...
I will keep an eye on this (I am abroad for the moment). |
01
Apr
22 |
Upload mar22.dat to data
archive. |
22
Mar
22 |
Our SPM10 pyranometer (ch.6. label Solarkip) show a condensation
problem since many months; water droplets form on both quartz domes.
It has been send back for repair. The graphs now show the readings
of our second CM21 pyranometer (ch.23, label Solarrad). The readings
given in the trends section for 2021 may by slightly too low; for
sunhine duration the CM21 readings give a higher total of 1682
hours. I added the CM21 readings to the "monthly" sheet of the
2022_only.xls file in the data archive. |
13
Mar
22 |
New calculation of the RAF (Radiation Amplification Factor) from
the last 8 sunny days in March:
Click to go to the Blog! |
11
Mar
22 |
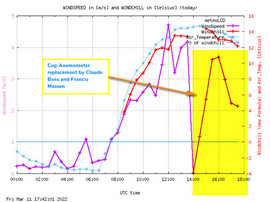
My friend Claude Boes and myself replaced today the old cup
anemometer by a new one. Claude did most of the perilous work, as he
is a good climber on ropes. Click here for a very short
video.
  |
07
Mar
22 |
1.
Work on all solar sensors (UVA,UVB and 2 pyranometers. Changed
dessicant, cleaned etc... Disregard downward peak in data during the
morning, caused by removing the sensors for the work to be done.
2. Changed filter of CAIRSENS ozone sensor.
|
01
Mar
22 |
Upload feb22.dat to data
archive. |
19
Feb
22 |
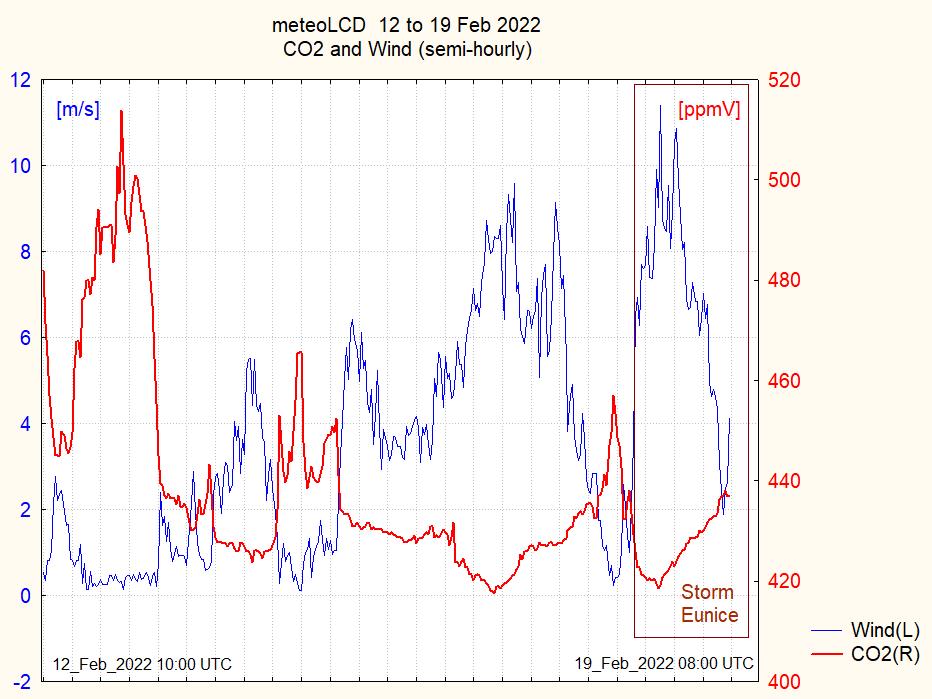
The storm Eunice which passed over Luxembourg during the last
hours gives again a nice illustration how wind speed affects CO2
levels: when wind speed is high, the lower air layers become well
mixed so that ground CO2 levels (which vary in an important way
during the day) become well mixed and minimal:
 
You may read
this paper I wrote with the late Ernst-Georg Beck and which
was published by Springer in 2009. |
02
Feb
22 |
1. Upload jan22.dat to data
archive.
2. Trends section nearly finished. TOC remains to be done, waiting
for Uccle data. |
18
Jan
22 |
I started today the update of the
TRENDS page; this
is a very time-demanding job, so be patient. Updates will be made
step by step. |
14
Jan
22 |
Uploaded 2021_only.xls
and
meteoLCDstats_1998_2021.xls files with 2021 data and summary
statistics into the data archive. |
02
Jan
22 |
Uploaded dec21.dat and 2021.zip (=
concatenated file with all months, .dat (=.csv) format) into the
data archive. |
01
Jan
22 |
1.
Our old faithful Delta_T datalogger does not store the year count in its
data-time column, so there usually is a mess with the Gnuplot 7-days
plots during the first week (but not with the "today" plots). 2.
Look here for an
overplot of our
2021 Total Ozone Column measurements with those made at
UCCLE by the RMI. As usual ours not too bad, no reason to be
ashamed of :-))!
|


