Francis Massen (francis.massen@education.lu)
Meteorological Station of the Lycée Classique de Diekirch (LCD)
http://meteo.lcd.lu
32 av. de la Gare
L-9233 Diekirch
May 2009. Version 1.03

Trends and Patterns in Atmospheric Optical Depth
at
Diekirch, Luxembourg (1997-2007)
|
Francis Massen (francis.massen@education.lu) May 2009. Version 1.03 |
 |
Abstract:
Starting Jan 1997, regular total ozone column measurements have been made at the meteorological station of the LCD at Diekirch, Luxembourg. The Microtops II sun photometers used do not only measure total ozone column, but also atmospheric vapour content and AOD at 1020nm. For the whole period, lowest background (= blue sky) AOD's at 1020nm were found during the months having the highest total rainfall. From 1997 to 2003 the overall trend was negative, reverting to positive for the 2004 to 2007 period, contrary to many global observations which show an ongoing negative trend since 7 years. Lower precipitation seems to be one cause of this recent increase in background AOD.
Index:
| 1. | Measurement site and equipment used |
| 2. | Theory of operation and details of measurement |
| 3. | Seasonal pattern from 1997 to 2007 |
| 4. | Trends from 1997 to 2007 |
| 5. | Conclusions |
| 6. | References |
1. Measurement site and equipment used
Total ozone column is measured at the author's home since 1997. This location is 3 km from the Lycée Classique de Diekirch, site of the meteoLCD station (http://meteo.lcd.lu). The small distance and similar altitude allow to consider both sites as identical: North latitude = 49.5°, East longitude = 6.1°, altitude ~ 200m asl. The manual measurements are made around 11:00 to 12:00 UTC if possible, pointing the sun from a south facing balcony. A steady hand and careful pointing are mandatory, as misalignments have a serious impact on the quality of measurements [1]
The two Microtops II sun photometers from Solar Light Company (http://www.solarlight.com) used in this study have 5 narrow band filters, three in the UV range for measuring the total ozone column and two more at 940nm and 1020nm. The latter wavelength is affected only by aerosol scattering and is used to compute the AOD (or AOT in Microtops parlance); the full width at half maximum (FWHM) of the 1020nm filter is 10nm.
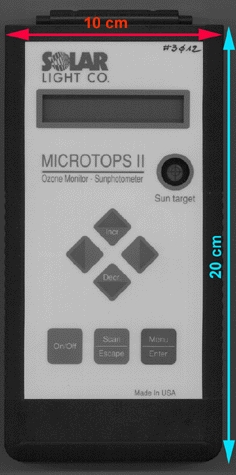 |
| fig.1. Microtops II sun photometer with AOD and water column options |
2. Theory of operation and details of measurement
The MicrotopsII AOD output basically is a voltage V2, which is related to the top of the atmosphere voltage by V2 = V02*exp(-tau*m). In this expression tau is the AOD and m the air mass, i.e. the ratio of the actual and vertical path of the sunlight reaching the detector. The air mass m ~ 1/cos(Z) where Z = solar zenith angle. The Microtops uses a slightly more complete polynomial expression for m:
m = sec(Z) - 0.0018167*(sec(Z)-1) - 0.002875*(sec(Z) -1)2 - 0.0008083*(sec(Z)-1)3 [2]
The top of the atmosphere voltage V02 is obtained by extrapolation from a Langley plot made on a sunny day by the manufacturer and is stored in the firmware of the instrument.
In this study, only measurements made during blue sky conditions are considered; this has the disadvantage to leave only 816 out of 4978 single measurements for use, but enables to compute seasonal patterns and long-time trends not influenced by changing cloud conditions. Blue sky means that not a single cloud is visible. The cloud condition parameter has routinely been noted during all measurements. These blue sky AOD's should be considered as representative for the background atmospheric turbidity at Diekirch, Luxembourg.
During the 1997 to 2007 period, two different Microtops instruments where used: #3012 from Jan.1997 to Sep 2003, and #5375 from April 2003 to Dec.2007. Instrument #3012 was sent back to the manufacturer in March 1999 for recalibration (the check showed none was needed). The almost 6 month overlap period allows to compare the AOD readings of both instruments, the newer model being the reference assumed "correct". If all measurements are taken into account (blue sky and cloudy days), a multiplier of 0.931 applied to the model #3012 readings is calculated by a linear fit through the origin (R2 = 0.55). The comparison between blue sky conditions shows the #3012 readings being usually much higher than those of #5375, for reasons unknown. A linear fit through the origin suggests a multiplier of 0.545 to apply to the #3012 readings (R2 = 0.47), as shown by fig.2. This calibration factor will routinely be used for all #3012 readings in this study, except when stated differently. The last observational data are from the 22th Dec.2007.
Here the details of the complete data series:
| instrument used | from ... to... | number of single measurements | number of measurement days | number of blue sky days |
| #3012 | Jan 1997 to Mar 2003 | 1190 | 529 | 114 |
| #5375 | Apr 2003 to Dec 2007 | 3788 | 678 | 129 |
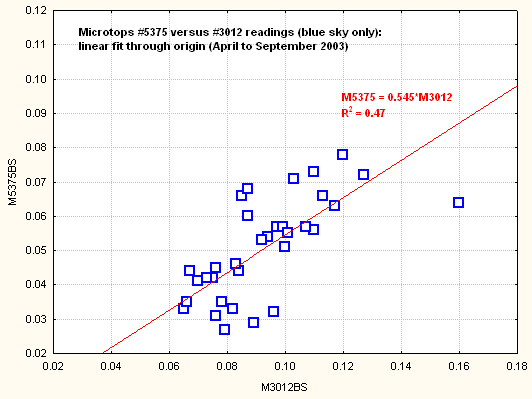 |
| fig. 2. Blue sky calibration factor to apply to Microtops #3012, #5375 assumed correct. |
3. Seasonal pattern from 1997 to 2007
3.1. Influence of rain fall
Many local or regional AOD measurements show a distinct seasonal pattern: low AOD's often correspond to the periods of the year having the most abundant rain fall which clears the atmosphere from particulate matters in suspension [7] Over the USA, the minima happen during the last trimester of the year [3]. The paper of Kazadsis et al.[4] on 9 years AOD measurements at Thessaloniki in Greece shows lowest local AOD's from October to February. A similar pattern can be found at Diekirch: the November to January period has the lowest AOD, the maximum being found in June, often one of the driest months. A similar situation is found at Uccle, Belgium [8].
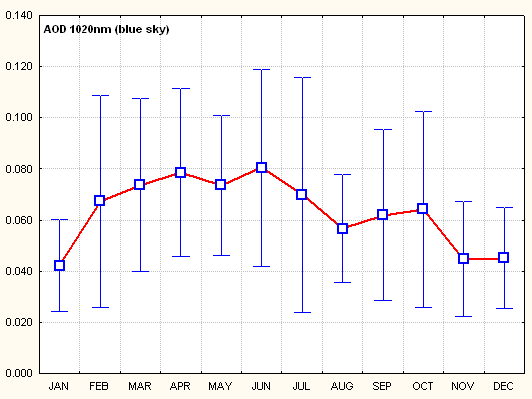 |
| fig. 3. Monthly mean blue sky AOD for 1997 to 2007 (mean +/- one standard deviation) |
The variation of mean monthly AOD and cumulative monthly rainfall for the years 1998 to 2007 at Diekirch clearly confirms that higher precipitation causes lower blue sky AOD; the relationship is reasonably linear (R2 = 0.51): AOD = 0.1755 - 2*10-4 *Total Rainfall. An absolute dry month would yield a blue sky AOD of 0.176, a month with 70mm precipitation an AOD of 0.070.
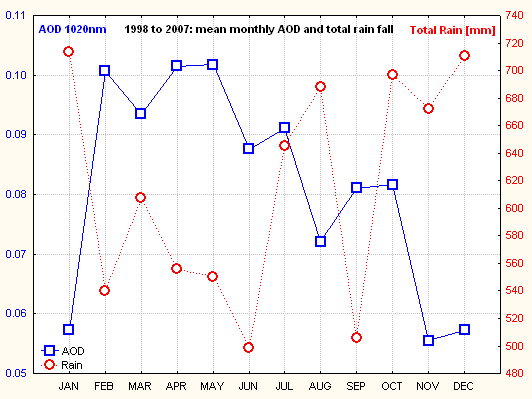 |
| fig. 4. Mean monthly AOD (solid line) over the 1998 to 2007 period and
total monthly precipitation (dotted line) anticorrelate: the wettest months Nov to Jan
have lowest AOD
|
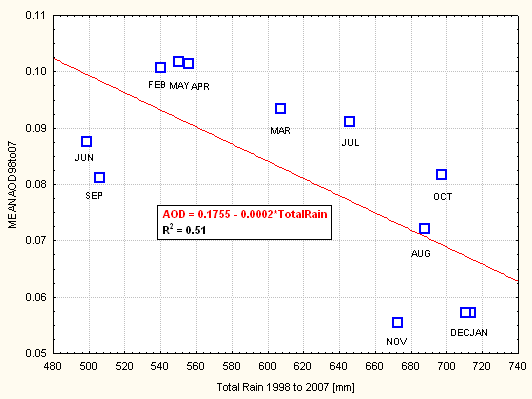 |
| fig.5. Linear trend between mean monthly blue sky AOD and total monthly rainfall for the 10 years 1998 to 2007 |
3.2. Seasonal pattern and periodicities
The 12 month periodicity visible in the time series can also be found in the autocorrelation signal computed from the interpolated series of mean monthly blue sky AOD The interpolation bridges a maximum of 2 consecutive missing months (3 gaps in the original) and a single missing month (11 gaps). Here we will use the full years 2000 to 2007. Fig. 6 shows the time series smoothed by a 3 point moving average; the local minima coincide visibly with winter months. A rather smooth sinusoidal pattern is apparent during 2001 to 2002, then is replaced by much more variability during the following years. For comparison fig.7 gives the global AOD at 500nm as measured by the Nasa satellite MISR spectrometer over land and ocean. This series also shows that a smooth yearly sinusoidal pattern is rather exceptional and not the norm. The Diekirch data for 2005 to 2007 also show the same characteristic dual peaks per year visible in the global series.
| fig. 6. Monthly mean blue sky AOD at 1020nm over Diekirch. Series smoothed by 3 point moving average |
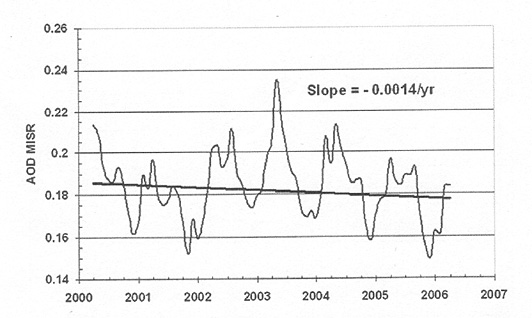 |
| fig. 7. Global AOD at 500nm over land and ocean as measured by satellite born MISR. Figure from [3]. |
The autocorrelation function of the unsmoothed series shows the 12 months periodicity peak, confirming the visual impression.
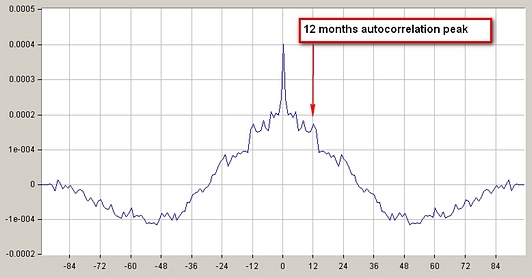 |
| fig.8. Twelve months period apparent in autocorrelation signal |
There is some ongoing debate concerning climate radiative forcings and atmospheric aerosols; together with clouds, aerosols constitute the least known aspect of atmospheric patterns and climate forcings; in IPPC parlance the level of scientific understanding (LOSU) is low [5].
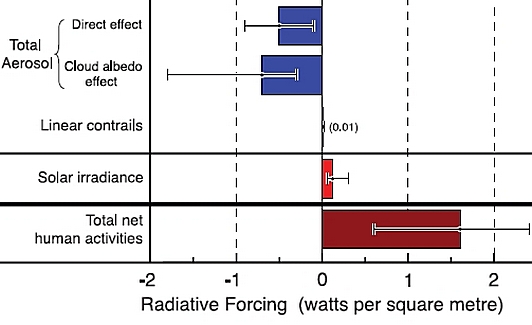 |
| fig. 9. Uncertainty of aerosol radiative forcings (IPCC, AR4 WG1, 2007) |
Chylek et al. [3] show that the North Hemisphere downward trend in AOD may change the "consensus" IPCC climate sensitivity to half it's assumed value. The warming produced by the more transparent atmosphere is possibly of the same magnitude than that of anthropogenic CO2 emissions. AOD changes are not uniform, neither in time nor regionally. For instance the NASA Earth Observing System Multiangle Imaging SpectroRadiometer (MISR) measured no AOD change in the South Hemisphere, but a downward trend of 0.0029/a for the NH (ocean and land) from 2000 to 2006. European observations also show a lessening of sulfate aerosol forcing starting in 1980 [6].
Our search for possible trends will use the monthly mean blue sky AOD's as given by fig. 10., eventually interpolated to bridge missing months if needed.
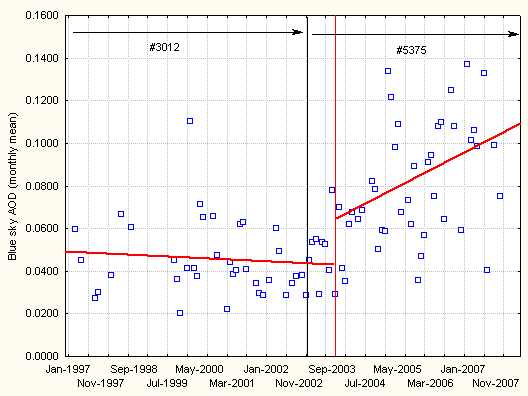 |
| fig. 10. Mean monthly blue sky AOD (1020nm) at Diekirch from Jan1977 to Dec2007 with linear trend lines (no interpolation) |
A simple inspection of the measured AOD suggests two periods with different
trends: from Jan07 to Aug03 the blue sky AOD varies approx. between 0.02
and 0.07 and the overall trend is slightly negative; starting Sep03 ( red line in
fig. 10) the variations become greater (between 0.04 and 0.14) and a rising trend
is noticeable. The black line indicates the switch from instrument #3012
(adjusted readings) to #5375. The first measurements made from Apr03 to Aug03 with the new #5375
( interval between black an red vertical lines) do not show a visible step up,
which suggests that the greater variability and higher readings are not an
artifact due to the switch of the instrument.
The next table shows the important increase in average values and variability between the two periods:
| Period | Number of days | AOD: mean +/- stdev |
| Jan97 to Aug03 | N = 124 | 0.0454 +/- 0.0166 |
| Sep03 to Dec07 | N = 119 | 0.0801 +/- 0.0287 |
Computing a linear trend over the whole period 1997 to 2007 does not make much sense, so two separate linear trends will be computed from the daily mean AOD for the 6 year period 1997 to 2002 and the 4 year period 2004 to 2007.
| Number of days | AOD: trend per year | mean total rainfall/year | trends per year in total rainfall: | |
| Jan 1997 to Dec 2002 | N = 35 blue sky days | -1.56E-3/a | 1998 to 2002: 856 | 1998 to 2002: +37.5mm/a |
| Jan 2004 to Dec 2007 | N = 39 blue sky days | +10E-3/a | 2004 to 2007: 614 | 2004 to 2007: +2.4 mm/a |
The first trend is of a similar magnitude as the global average AOD (500nm) trend of -1.50E-3/a for the period 1985 to 2005 reported by AVHRR over ocean; it also is close to the MISR trend of -1.40E-3/a over ocean and land for the 2000 to 2005 time span [3].
The second period shows a clearly positive AOD trend. A hint to a possible stop or slowing of the recent atmospheric brightening can be found in the 2004 and 2005 NH minima MSIR AOD's, which show a slight increase. Over the continental USA the yearly minima from 2003 to 2005 are more or less constant but the 2005 maximum increases substantially by +0.03 over the preceding one. [3]
The mean cumulative precipitation is noticeably lower at Diekirch during that second period of rising AOD's. This lower "air washing" effect should at least account for the important stepwise increase in AOD and for the positive trend after 2003. Ongoing emissions, even if constant, on top of an incomplete aerosol washout must yield a rising AOD.
The following table gives an overview of the averages of the usually low AOD November-January and the high AOD May-July months. Start date is winter 1999, as the two preceding years have too many missing months.
| High AOD period | Mean AOD | Rain fall [mm] | Low AOD period | Mean AOD | Rain fall [mm] |
| Nov99 to Jan00 | 0.03073 | 245.0 | |||
| May00 to Jul00 | 0.06733 | 265.8 | Nov00 to Jan01 | 0.03072 | 385.6 |
| May01 to Jul01 | 0.05533 | 174.2 | Nov01 to Jan02 | 0.02998 | 164.0 |
| May02 to Jul02 | 0.03888 | 143.6 | Nov02 to Jan03 | 0.03491 | 316.4 |
| May03 to Jul03 | 0.04526 | 170.6 | Nov03 to Jan04 | 0.04873 | 189.6 |
| May04 to Jul04 | 0.06856 | 149.0 | Nov04 to Jan05 | 0.05589 | 121.2 |
| May05 to Jul05 | 0.08230 | 123.6 | Nov05 to Jan06 | 0.04652 | 120.8 |
| May06 to Jul06 | 0.09402 | 146.2 | Nov06 to Jan 07 | 0.08028 | 211.2 |
| May07to Jul07 | 0.11554 | 233.0 | . | . | . |
This table gives a clear cause for a possible upwards trend of both summer and winter AOD after 2003: summer rain fall from 2004 to 2006 is lower compared to the preceding years (2006 and 2002 being about the same); winter rainfall also is very depressed during 2004 and 2005. The last 2 seasons in the record do not follow the rule, as they have high precipitations and high AOD's. This seasonal analysis suggests the possible existence of a second, not precipitation related cause for the increase in atmospheric turbidity.
Fig 7. illustrates the situation; hollow symbols correspond to the Nov-Jan season, full symbols to the May-July period. Left axis = AOD, right axis three months total precipitation in mm.
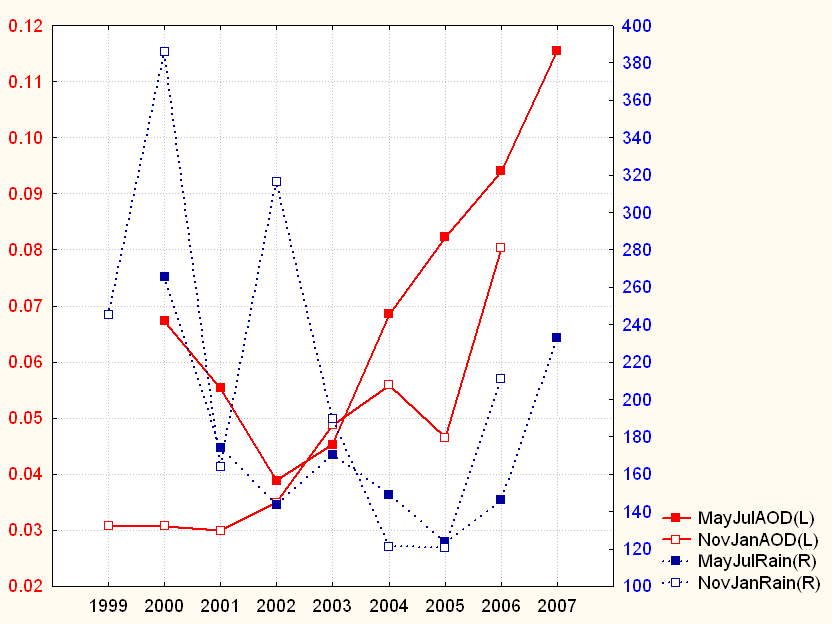 |
| fig. 11. Changes of wet and dry season AOD and total rain fall (mean AOD and total rainfall over 3 months) |
The reversal from a negative to a positive trend is also found at the Royal Meteorological Institute (RMI/KNMI) in Uccle, Belgium, about 150km West from Diekirch, similar latitude. The RMI/KNMI poster [8] by Cheymol et al. shows a downtrend in AOD (derived from UVB observations) from 1992 to 2003, followed by an increase during 2004, the last year of the observations. This would confirm that the upward trend observed in Diekirch is genuine.
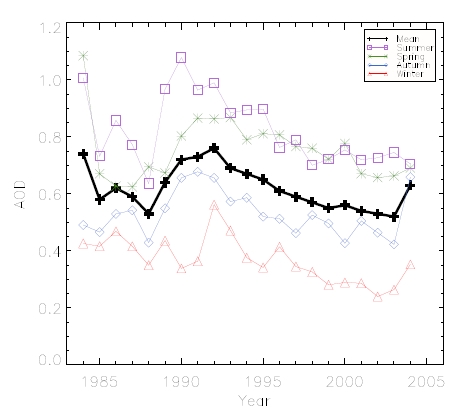 |
| fig. 12. Black line shows mean yearly AOD (derived from UVB measurements) at Uccle, Belgium. Figure from [8]. Notice the reversal from down trend to an increase after 2003. |
The same reversal is documented in the paper of Vautard et al. [9] on the decline of fog, mist and haze in Europe over the past 30 years published in Jan.2009 in Nature Geoscience: in this study the reversal is clearly apparent during the winter months (here Jan-March and Oct-Dec), starting from the year 2000 on (fig.13)
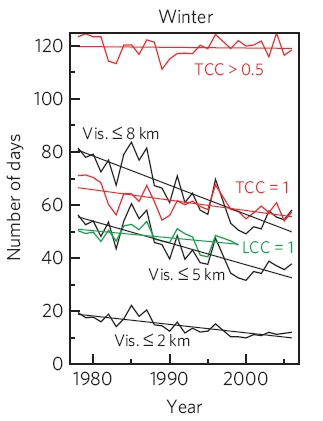 |
| fig.13. Downtrend in visibility during the winter season reverses to positive from year 2000 on. (from [9], figure 4a) |
This study of 11 years AOD measurements shows that the local background
atmospheric turbidity at Diekirch, Luxembourg, is strongly influenced by total
rainfall, as found by numerous other authors. All things being the same,
increased precipitation washes out the suspended aerosols and decreases the AOD.
A negative linear trend has been found for the period from 1997 to 2003; it's
magnitude is comparable to that measured from 2000 to 2005 by the satellite
flown MISR instrument over ocean and land. The negative trend reverses to
positive from 2004 to 2007 similar to the observations made at Uccle, Belgium
and also related in the Vautard et al paper. The decrease in background AOD during the first period might be caused by two combined factors: lower anthropogenic aerosol emissions and
higher rain fall. The subsequent rise in AOD is certainly caused by noticeably
lower precipitation from 2004 to 2006. The ongoing positive trend during 2007
despite rising rainfalls suggests either a still insufficient aerosol washout
and/or a possible second different cause.
| [1] | Massen, F.: Influence of intentionally mis-pointing on Microtops II readings, 2003. http://meteo.lcd.lu/papers/microtops/mispointing/mtopserrors01.html |
| [2] | Morys M., Mims F.M III, Anderson S:E: Design, calibration and performance of Microtops II hand-held ozonometer (www.solarlight.com/download/grlpub.pdf) |
| [3] | Chylek, P. et al: Limits on climate sensitivity derived from recent satellite and surface observations. Journal of Geophysical Research, vol.112, D24S04, 2007 |
| [4] | Kazadsis, S. et al.: Nine years of UV aerosol optical depth measurements at Thessaloniki, Greece. Atmospheric Chemistry and Physics, 7, 2091-2101, 2007 |
| [5] | IPCC: AR4, Synthesis report, 2007 http://www.ipcc.ch/ipccreports/ar4-syr.htm |
| [6] | Marmer, E. et al: Direct shortwave radiative forcing of sulfate aerosol over Europe from 1900 to 2000. Journal of Geophysical Research, 2007, 0148-0227/07, special issue, in press. |
| [7] | Cheymol A. et al: Retrieval of the aerosol optical depth in the UV-B at Uccle from Brewer ozone measurements over a long time period 1984–2002. Journal of Geophysical Research, vol. 108, no. D24, 4800, 2003 |
| [8] | Cheymol A. et al: Retrieval of the aerosol optical depth over 20 years at Uccle in Belgium in the UV-B. KNMI/RMI poster. ftp://ftp.kmi.be/dist/meteo/hugo/posters/cheymol/eac2005_Cheymol.pdf |
| [9] | Vautard R. et al: Decline of fog, mist and haze in Europe over the past 30 years. Letters to Nature Geoscience, 18 Jan 2009. DOI: 10.1038/NGEO414 |
Please cite:
Massen, F. Trends and Patterns in Atmospheric Optical Depth at Diekirch, Luxembourg (1997-2007). http:/meteo.lcd.lu, 2007.
History:
| version 1.0 | 30 Dec 2007 | original version |
| version 1.01 | 31 Dec 2007 | Added references 6 to 8. Corrected no.of figure 11. Added
fig. 12. Some minor editorial corrections. Added history of versions |
| version 1.02 | 04 Jan 2008 | changed font to Arial for better
readability some minor cosmetic changes |
| version 1.03 | 21 May 2009 | added fig.13, reference and comment on Vautard et al paper. |