| ESR and CM21: A Short Intercomparison of Two Solar Sensors |
This paper has been prepared by students of the specialised course on climate (OSCIE) of the Lycée Classique Diekirch, academic year 2002-2003, 1st semester: Jill Besenius, Jeff Braun, Paul Hirsch, Marianne Kellen, Ann Kieffer, Kim Schalbar. Teacher: Francis Massen
file: twosolarsensors.html
version: 1.0 17 Feb 2003
| Abstract | The inexpensive ESR solar sensor from Delta-T Devices is compared to the professional CM21 pyranometer from Kipp + Zonen (WMO class 2 device). This report shows that the much cheaper ESR can be used as a stop gap in case of failure of the CM21. The differences between the 2 sensors are dependent of ambiant air temperature, but seem to not to vary with higher solar irradiances. |
| Index |
|
1. Description of the ESR and CM21 sensors
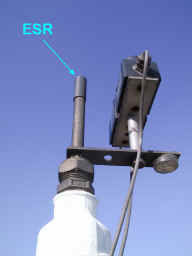
The ESR sensor (serial number ES/19669)
from Delta-T Devices is based on a Si
photodiode
housed in a black, non ventilated casing covered by a plastic diffuser. Its
spectral range ( > 50% rel. spectral response) extends from 400nm to 1000 nm and
the output is 1mV/(W/m2).
The accuracy of the sensor is not known. The sensor signal is read by a Delta-T
Devices DL2 datalogger programmed to make one reading every minute and to store the average
of 30 readings every half hour.
Both sensor data were corrected for a midnight zero-offset (highest offset of
the reference period added or subtracted).
| Picture of the Delta-T ESR solar radiation sensor on its mounting mast | |
| Relative spectral response of ESR sensor as given by the manufacturer; the curve is reasonably flat between 500 and 900nm. | 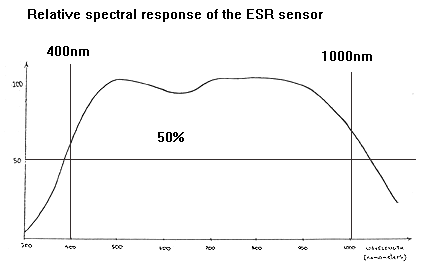 |
The CM21 pyranometer from Kipp & Zonen is a thermopile-type pyranometer covered by a double quartz-glass dome; its spectral range extends from 300nm to 2800nm, a much larger range than the ESR. The instrument ( called KIP in this report) used by meteoLCD is continously ventilated to minimize temperature influence. The relative spectral response is unknown.
| The Kipp & Zonen CM21 pyranometer | 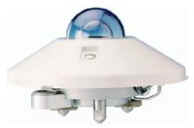 |
2. Comparison of both sensors during colder and warmer days
For this comparison, we use (nearly) cloudless days in April and June having markedly different temperatures.
2.1. Cold day
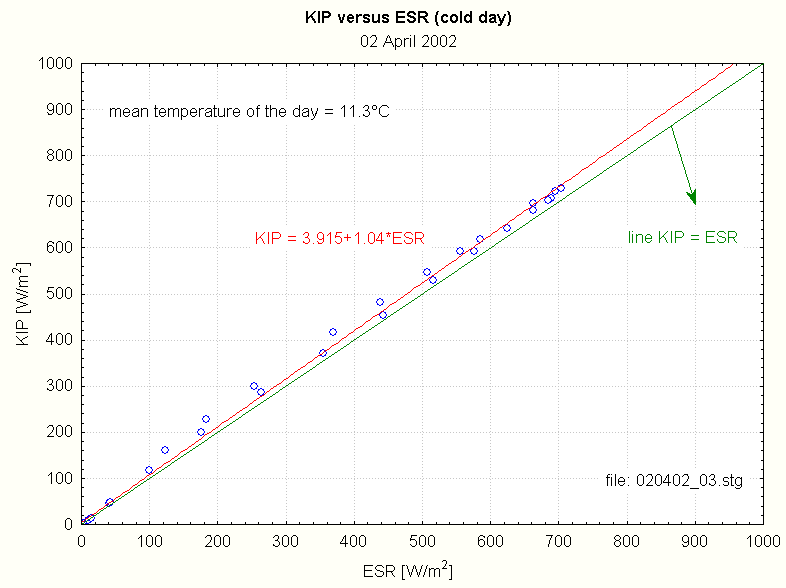
The 2nd April 2002 has a minimum temperature of 1.8°C, a maximum of 22.3°C and a mean of 11.3°C:
| The figure shows that both sensors agree reasonably well, with ESR readings always slightly lower than the KIP readings. | 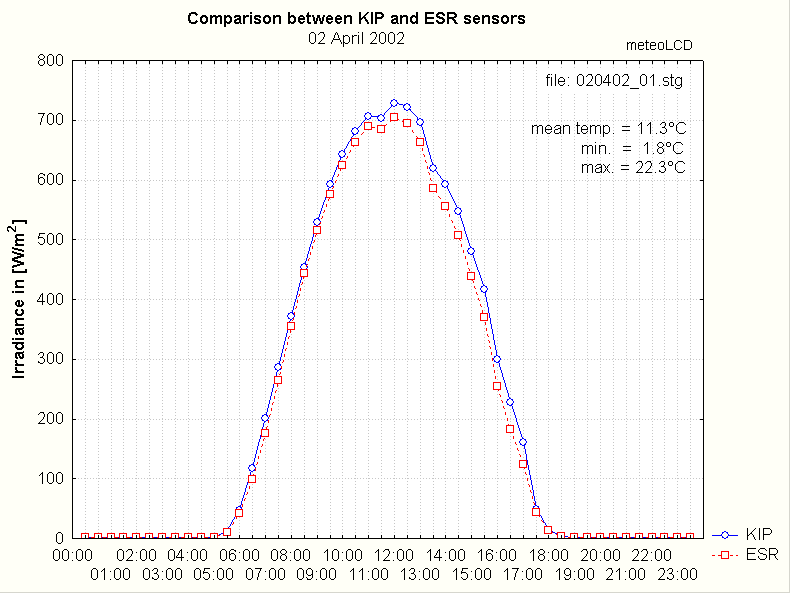 |
| Plotting Kip data versus ESR data gives a best fit of: KIP = 3.9 + 1.04*ESR This is the calibration curve to apply to the ESR readings for colder days |
 |
2.2. Warm day
The 18th June 2002 has a minimum temperature of 17.1°C, a maximum of 33.4°C and a mean of 25.1°C:
| This time, the ESR readings are slightly higher than the KIP readings | 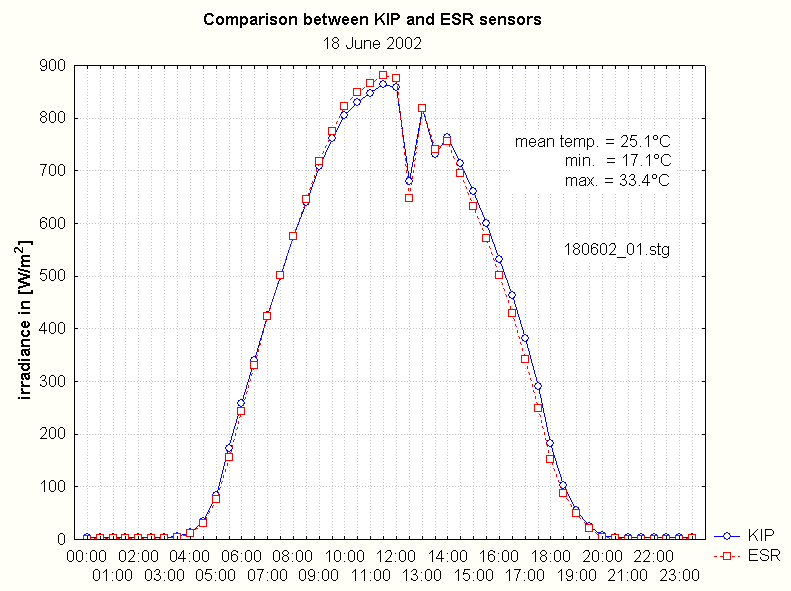 |
| Plotting Kip data versus ESR data gives a best fit of: KIP = 9.1 + 0.99*ESR This is the calibration curve to apply to the ESR readings for warmer days. One should note that the offset is more than the double of the preceeding day! |
 |
The specifications of the ESR give a temperature dependance of -0.1% per °C, without specifying the reference temperature. Let us assume this to be 25°C (as is often the case) and that the minus sign means that a negative correction should be applied above 25°C and a positive one below 25°C. The comparison of the maximum irradiances for the two days gives the following result:
| day and time | max. irradiance [W/m2] (KIP) | air temperature [°C] | ESR reading | ESR corrected | computed correction % per °C (rounded) |
| 02Apr02 12:00 | 728.3 | 19.0 | 704.4 | 708.6 | +0.6 |
| 18Jun02 11:30 | 863.6 | 30.8 | 881.8 | 876.7 | -0.4 |
3. Differences between the sensors related to solar irradiance
Let us compare two days with approx. same air temperature, but different solar irradiances; these two days should be close, so that the mean angular position of the sun will be nearly the same.
The 20th and 21th June have practically same temperature and (due to changing cloudiness) different irradiances: the maxima are 754 and 603 W/m2 (CM21)
| The figure shows air temperature and readings from the 2 sensors during the 2 days | 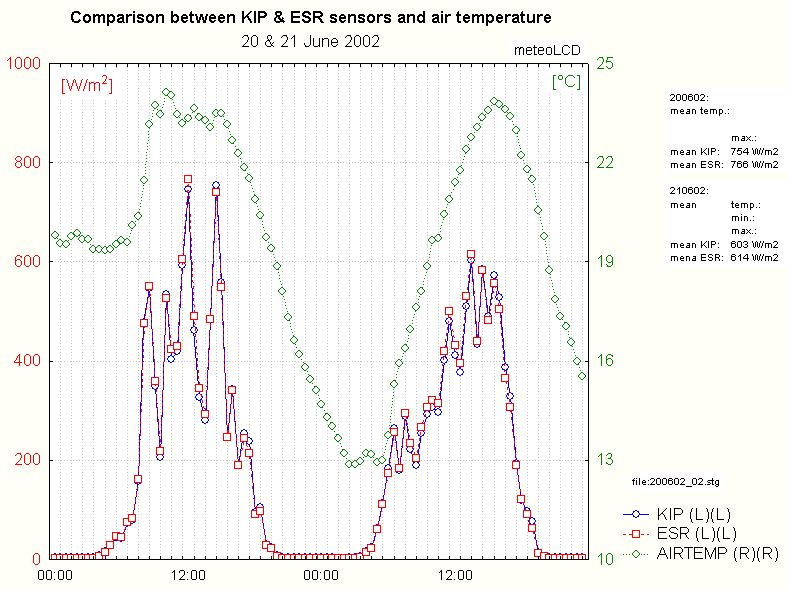 |
| During the days with the highest irradiance, the offset between the sensors is 1.758 and the scaling factor 0.988 | 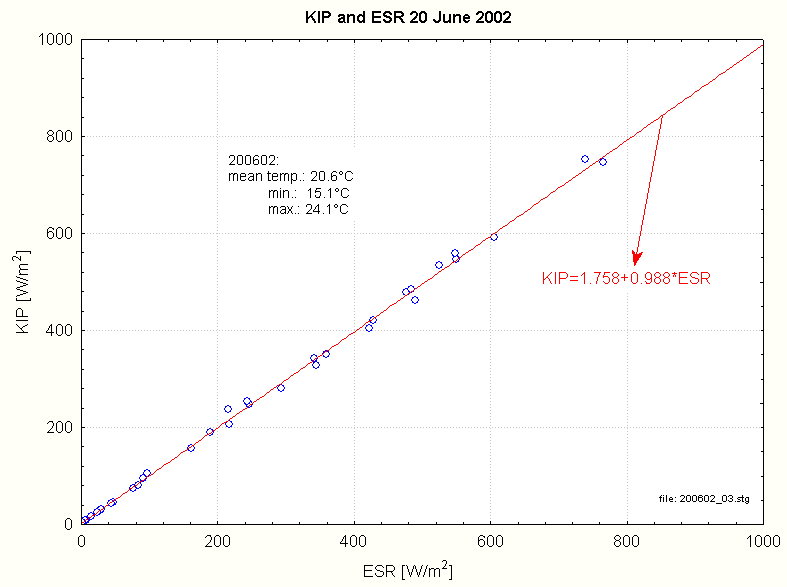 |
| The 21th June the (peak) solar irradiance is lower, but the offset and scaling factors are nearly the same: 1.930 and 0.986 |  |
This short paper shows that the principal parameter having an
influence on the ESR sensor readings is air temperature:
during colder days, the ESR readings are too low, and during
warmer days they are too high:
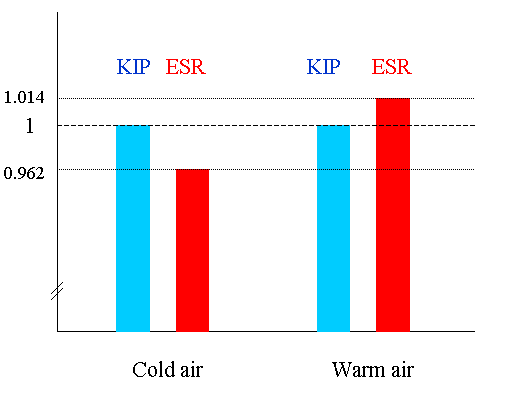
The differences in the scaling factors are quite small and tolerable for a relatively inexpensive
instrument (the picture shows the relative scaling differences).
The offset between both sensors seems to vary in a not predictable manner (see for instance the small offset during the 20 & 21 June, and the quite large offset of 9.1 during the 18th June)
The ESR may be used with confidence as a backup instrument in the case of a failure of the KIPP & Zonen pyranometer. The loss of accuracy will probably not exceed 4 % under normal temperature conditions.