Mean and extreme daily air temperature trends (Diekirch, Luxemburg): 1998 to 2003
file: dailymin_max_1998_2003.html
Abstract:
Both daily mean and daily maximum air temperatures at Diekirch show a positive trend from
1998 to 2003, whereas the mean daily minimum temperature is decreasing, and as a
consequence the difference between minimum and maximum temperature has a
positive tend. This is contrary to the findings of the IPCC for the years 1950
to1993.
This report on a much too short time-span should not be taken as a proof
of an ongoing global warming trend!
1. Linear trends from 1998 to 2003 (6 years)
Temperature trends for the Northern Hemisphere landbased
stations usually show a mean daily temperature increase with the following
pattern
[1] [3]:
- the daily mean temperatures have a positive trend
- the positive trend of the daily minimum temperatures is about ( or at least) 2 times greater
than the positive trend of the daily
maximum temperatures
- as a consequence the difference between maximal and minimal daily temperatures
(DTR) is decreasing
This short report checks the meteoLCD data of the last 6 years (http://meteo.lcd.lu/data/2003_OKK_fm.zip)
for similar
trends, with a partial comparison to the data of the Findel airport station
(www.airport.lu); the measuring conditions have been practically been unchanged at meteoLCD (same sensors, relocation distance less than 50m); the analysis is
restricted to the yearly means computed from the set of daily means.
| parameter | mean values |
meteoLCD yearly trend [°C/year] |
yearly trend for Findel [°C/year] [Drogue, ref.2] |
|
| meteoLCD 1998..2003 |
Findel 1971-2000 |
|||
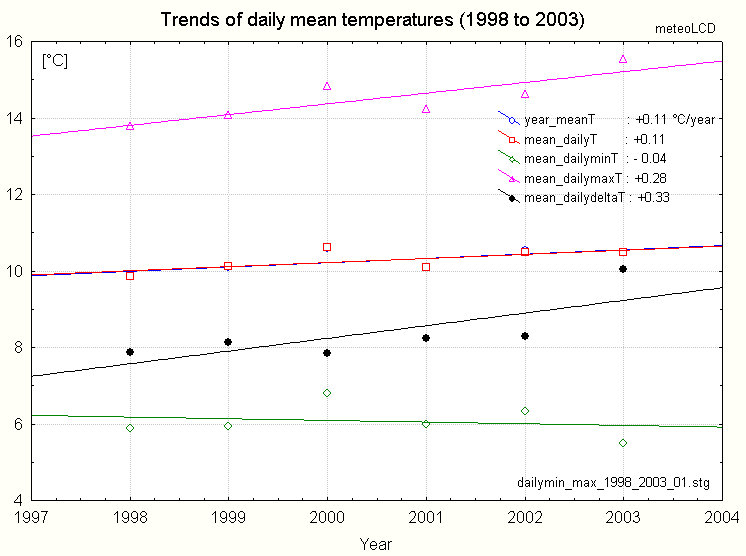
| yearly mean temperature |
10.3 | 8.8 | + 0.11 | 1977..1998: 0.07 |
| mean of daily minimum temperature | 6.1 | 5.1 | - 0.04 | 1949..1998: + 0.03 |
| mean of daily maximum temperature | 14.5 | 12.7 | + 0.28 | 1949..1998: + 0.07 |
| mean of daily delta temperature DTR |
8.4 | 7.6 | + 0.33 | 1949..1998: + 0.04 |
The graph shows that the minima temperatures have a slight negative
trend, the maxima a visible positive trend of 0.28°C/year; the latter is mostly
caused by the extreme hot 2003 summer; without the year 2003 the trend of the
mean daily maxima is only 0.19°C/year..
The trend of the mean difference of maxima and minima temperatures DTR is +0.33°C/year.
All these findings are opposite to the [1950-1993] trends given by the IPCC
and Karl,
except the positive trend in mean and maxima temperatures.
Drogue [2] finds in his analysis on the 1949 to 1998 Findel airport data both
trends being positive, the maxima increasing at a double rate to the minima
(again opposite to IPCC).
The magnitudes of the meteoLCD maxima trends are (not unexpectably) much higher than those
usually given for larger time-spans.
2. Trend in daily extremes [min(min) and
max(max)]
Is there an evolution to more extreme temperatures?
Checking for the yearly lowest daily minimum ( = min. of min, as opposed
to mean of min. used in the previous chapter) and highest daily maximum temperature
gives the following trends (statistically significant at 95%):
| parameter | yearly trend [°C/year] |
| min of daily Tmin | - 0.49 |
| max of daily Tmax | + 0.60 |
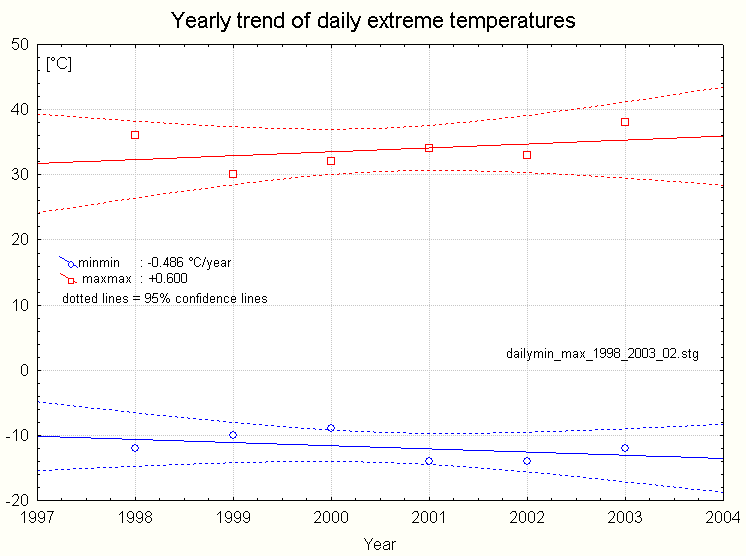
Both trends are significative, and show (surprisingly!) extreme colds becoming colder and (as expected) maxima temperatures rising.
The percentage of days where the temperatures are lower or higher than the means are close to 50% (mean and median are close, as confirmed by calculation) and do not show a visible trend: even if the extreme temperatures seem increasing, one can not affirm that the number of the "extreme" days augments.
| year | number of days where temperature is lower than mean |
number of days where temperature is higher than mean |
| 1998 | 159 = 44% | 175 = 49% |
| 1999 | 171 = 51% | 163 = 49% |
| 2000 | 163 = 47% | 159 = 49% |
| 2001 | 162 = 45% | 178 = 48% |
| 2002 | 177 = 48% | 180 = 49% |
| 2003 | 187 = 51% | 169 = 46% |
3. Conclusion
Yearly mean and mean daily maxima temperatures are increasing during the last
6 years, whereas the daily minima are slightly decreasing.
The rate of the positive trends is very high, compared to the findings made on
much larger data sets. Extreme temperatures seem to be drifting in opposite
directions.
Temperature trends should never be accepted on a time-span less than 30 years,
so this short report should under no circumstances be taken as a proof for a
definitive ongoing warming, but only as a quick glance on the last 6 years
pattern.
4. References
| 1 | IPCC, 2001 : Third Assessment report. www.ipcc.ch |
| 2 | Drogue G. et al : Recent warming in a small region with
semi-oceanic climate, 1949-1998: what is the ground truth? drogue@crpgl.lu. Submitted to Theoretical and Applied Climatology. |
| 3 | Karl T. et al : Asymetric Trends of Daily Maximum and Minimum Temperature. Bulletin of the American Meteorological Society, Vol.74, No.6, June 1993, p. 1007-1023 |