Mean annual temperature data for Luxembourg: 1951 - 2004
file: luxbg_temp01.html
version 1.1b
last update: 24 Aug 2005
Abstract:
This is a short ongoing report on the
trend in mean annual surface temperatures of Luxembourg, computed from the archive
of Nasa
GISS [1]. Graphs and linear fits have been made including all years, and only years
1990 to 2004 with and without the heat-wave year 2003. The general annual trend
of the whole period is a temperature increase of about 0.0132 °C/year, what
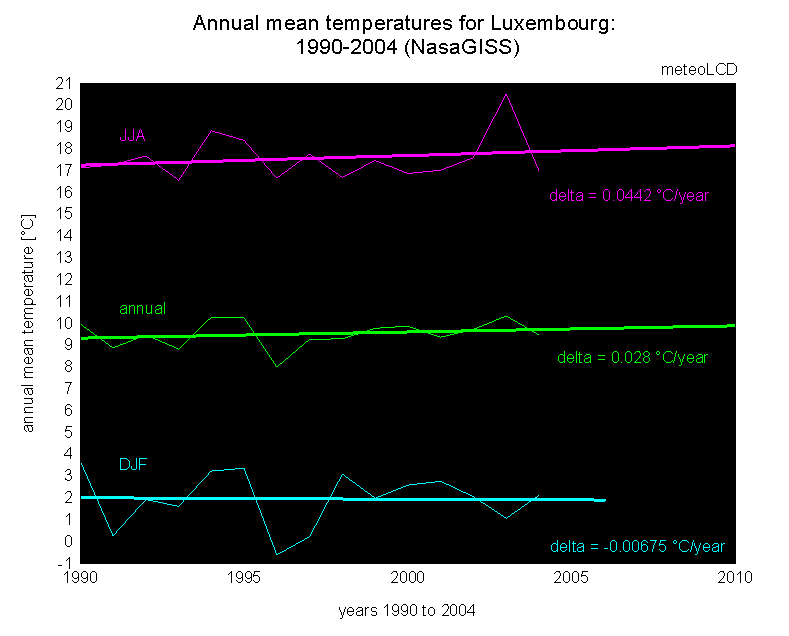
gives 0.7 °C for the 54 year period. For the last 15 years (1990 - 2004) this
trend becomes 0.028 °C/year, an increase essentially caused by the 2003
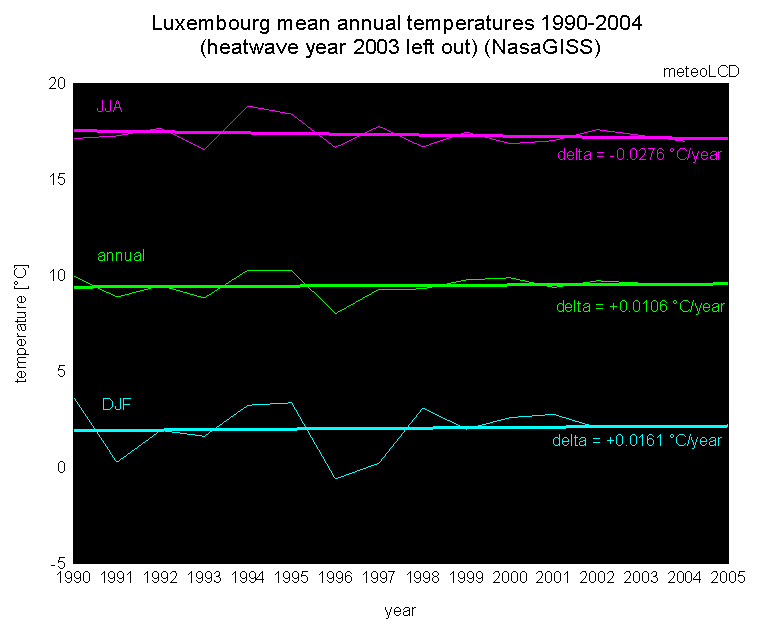
heat-wave; omitting 2003, the trend is only 0.0106 °C/year. A comparison with
the Mauna Loa CO2 data gives a mixed picture for the relationship between local
temperature and global CO2.
It should be noted that the data come from Luxembourg's Findel meteorological station, located
at the national airport in a region of ongoing urbanization and vastly
increasing air traffic. The data have probably not been adjusted for an urban
heat island effect.
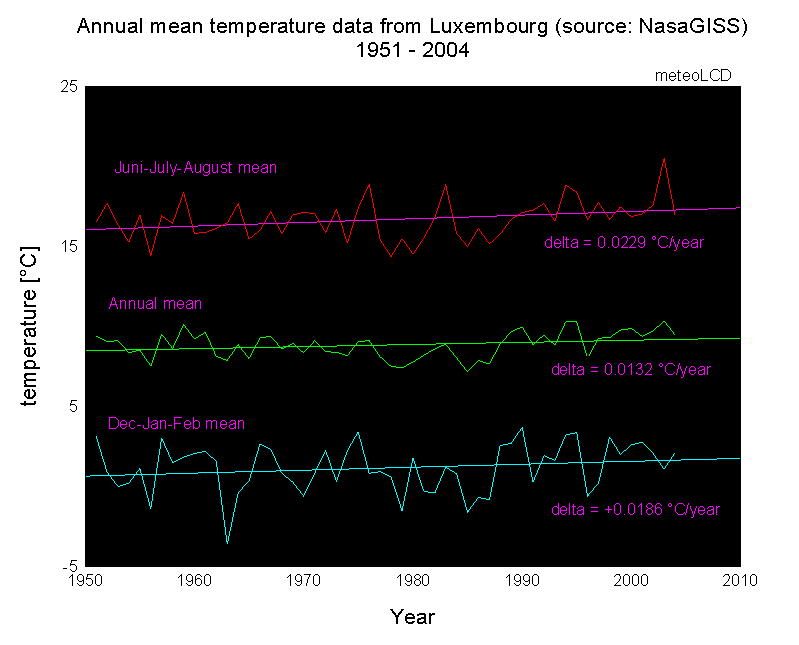
1. Mean annual temperatures for 1951-2004, all data
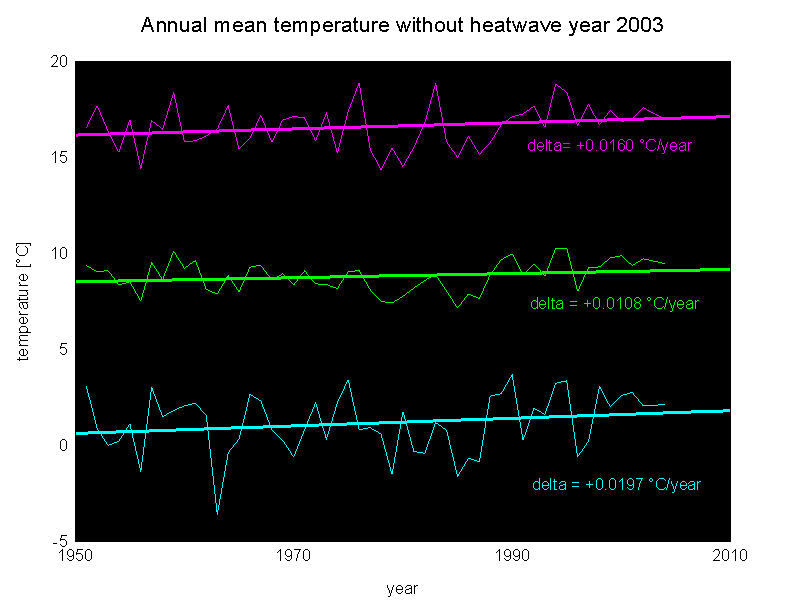
2. Mean annual temperatures for 1951-2004, heat wave year removed
3. Mean annual trend for 1990-2004, all data
4. Mean annual trend for 1990-2004, heat-wave year 2003 left out
5. Conclusion
It comes as a surprise that the summer trend gets negative
for the 1990-2004 period, if the exceptional warm 2003 period is left out; the
winter trend is negative on that same period due to the cold 2003 winter, and
becomes positive if 2003 is omitted. This massive (albeit rather short-term)
heat wave event ups the mean decadal warming for 0.024 °C !
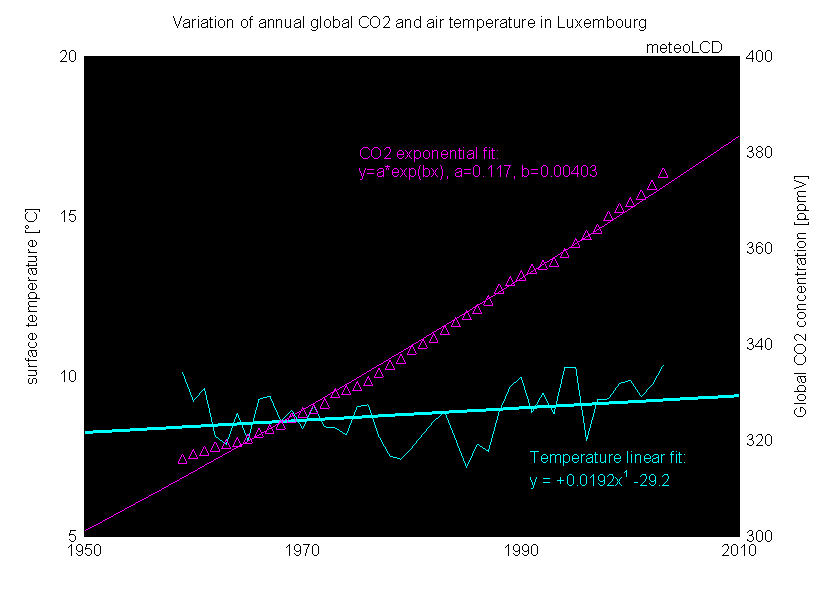
The annual trend of 0.0132 °C has to be compared to the global warming of about
0.0174 °C/year, as given by NasaGISS [2] for the (nearly) continuously warming
period 1975-2004, or 0.0084 °C/year as derived from the satellite MSU
measurements [3] from 1979 on. If the warming in Luxembourg would continue unchanged, the mean annual
temperature increase for 2100 would be 1.98°C.
The surface temperature linear trend contrasts with the quasi exponential increase in global CO2 concentration, a fact often mentioned by many authors (for instance [4] ): this linear trend = 4.76*exponential growth factor (global CO2 concentrations see [5]).
Plotting surface temperature versus the monotonously increasing CO2 concentrations shows clearly two different periods during the last 45 years: from 1959 to 1987 mean temperatures decreased versus CO2 concentration, from 1988 to 2003 they increase:
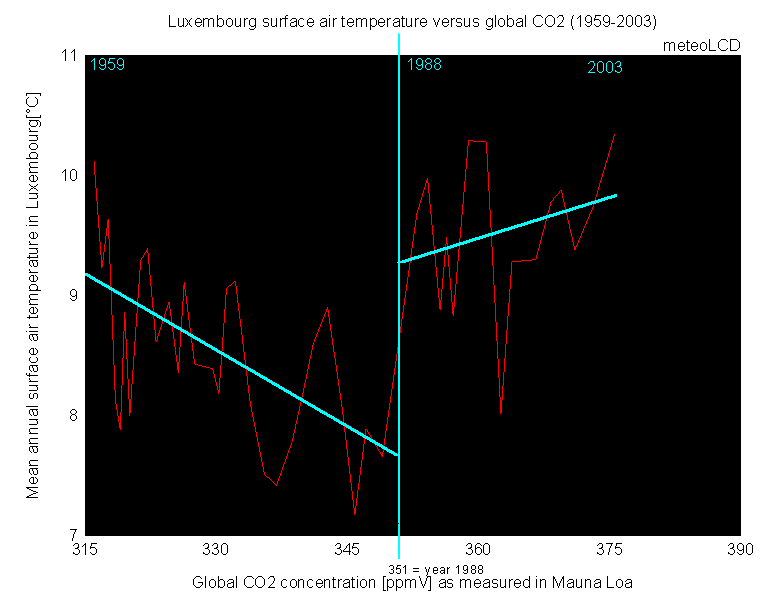
This should be a clear warning in seeing an exclusive causal relationship between CO2 increase and warming: elementary physics tells us that CO2 is a greenhouse gas and should produce some warming; the data show that other factors beside CO2 must be acting! If we compute a climate sensitivity from the logarithmic fit to the 1988-2003 data, we find a temperature increase of 5.6°C for a doubling of the 1988 concentration (i.e. for 702 ppmV); this is purely speculative, as the period 1959 -1987 shows that the positive trend may revert to a negative one!
Hans Erren [6] gives the following formula to compute the warming dT for a change in [CO2] (no feedbacks!):
dT=[alpha]*ln([CO2]/[CO2]orig)/(4[sigma]*T^3)
with alpha = 5.35
A doubling of the 1950 [CO2] would compute to dT =
5.35*ln(2)/(4*5.6705E-08*(281.4^3)
with T = 281.4 K = 8.4°C as the 1950 mean temperature derived from the linear
fit and 5.6705E-08 Boltzmann's sigma constant
dT = 0.73 K
which is a much more plausible result based on
sound physics!
Using a water-vapour feedback amplifier of 1.3 [7] this would give a
still modest dT = 0.95 K or °C.
We will compare these trends with those of Trier Petrisberg located in Germany about 30km away asap, and also make an analysis on the variability for different periods.
6. References
[1] Nasa GISS data base: http://data.giss.nasa.gov/cgi-bin/csci/csci_station.py?id=629065900002&data_set=1
[3] UAH http://climate.uah.edu/
[4] Michaels, Patrick & Balling, Robert C. Jr.: The Satanic Gases. Cato Institute 2000. ISBN 1-882577-91-4 & ISBN 1-882577-92-2
[5] Keeling C.D. et al: Mauna Loa CO2 data
[6] Erren, Hans: How does CO2 respond to temperature ?
(http://home.casema.nl/errenwijlens/co2/howmuch.htm)
[7] Ramanathan and Vogelmann ,1997 (http://www-ramanathan.ucsd.edu/publications.html)
Calculations and graphs made by Easyplot 4.0 from Spiral Software
History:
06 Nov 2005: changed modified links [1] and [2]