19-Feb-1996, release 2.1
06-Mar-1997, release 3.0
Nico HARPES, Radiation Protection Office
1. Sensors, mean efficiency and calibration factors
UV sensors (as many other sensors) do not have the same response throughout the whole spectrum; the relationship between the real value (= real existing irradiation) and the reponse of the sensor is modulated by a relative specific sensitivity curve (which in general is known and has been established by the manufacturer).
Let us define the following parameters:
reading value= output of the sensor, in the units that apply to the measured
parameter
(e.g. W/m2 for UV irradiance, or MED/h for biologically effective irradiance)
real value = real (true) value of the parameter, such it would be given by an ideal sensor
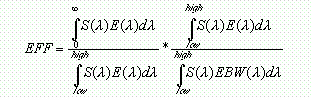
The mean_efficiency EFF can only be determined for a given spectrum defined by { S(lambda) }, where S(lambda) is the irradiance at wavelength lambda, measured in [W/(nm*m2)]
The mean_efficiency EFF can be computed from the following relation:
The first fraction is a window that reduces the sensors sensitivity (which may extend
beyond the (low, high) region) to the (low,high) part of the spectrum.
Example:
Our UV_B sensor can detect UV between 280nm and 360nm, whereas the UV_B range is defined as [280nm...319nm]. So low = 280 and high = 319
The second fraction reflects the sensors response in respect to an "ideal" sensor. EBW(lambda) is the weighting curve ( e.g. the biologically weighted spectral efficiency (CIE)) to apply if a biologically effective irradiance is to be measured; this is important to know if one wants to determine the maximum exposure time to sunlight before getting burned. If absolute irradiance is measured EWB(lambda) = 1.
The formula above simplifies to:
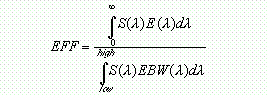
and the calibration factor to compute the real_value from the reading_value is 1/EFF
2.1. Interpreting the Delta_T UV_A values: state of
knowledge: end 1995
The values stored in the data-files represent the raw output of the UV_A sensor. To get
the exact total irradiant power (in W/m2), this number must be modified to respect the
non-uniform spectral sensitivity of the sensor used: a special silicon photodiode,
pointing upwards, and covered by a cosine-diffuser; if the angle of incidence is less than
75 degrees (sun makes angle superior of 15 degrees with respect to the horizontal), the
output of the upwards pointing sensor is independant of the angle; at 80 degrees, output
falls to 86%, at 85 degrees to 68%.
As stated in README.TXT, the relative spectral sensitivity response curve of the UV_A sensor is a slightly asymetric bell curve, which extends from 320nmm to 400nm (the domain usually defined as the UV_A range) and peaks at 370nm.
To compute the real UV_A irradiant power falling on a horizontal surface from the stored values, one has to take into account that the irradiant power of the solar-light is not quite constant over this wavelength region (and varies with the seasons,the position of the sun, the atmospheric conditions ...)
Based on an curve of the solar spectrum (measured at Munich, Germany) and which is valid for a sun-position of about 60 degrees above horizon, one finds this:
EFF = 14.25/35.47 = 0.402
CALIBRATION_FACTOR = 1/0.402 = 2.49
An example:
The UV_A sensor output is 6 W/m2; the total irradiant UV_A power in the [320..400nm] region falling on a horizontal surface is: irradiant UV_A power = 6 * 2.49 = 14.94 W/m2
If one starts with the simplified hypothesis of an uniform power distribution of the solar light in the 320 to 400nm region, the multiplier will be given by the fraction of two areas: a rectangular area with width (400-320=80) and height 100%, and the area under the bell-shaped relative spectral response curve, which computes to 3071. So this multiplier would be 8000/3071 = 2.61 (about 5% more than the preceeding one).
Mr. Markus WALLASCH from the Umweltbundesamt at Offenbach, Germany (located about 150km East of Diekirch, same latitude) helped in a first calibration-study based on the UV_A measurements from 01_Jul_94 to 14_Sep_94; the result is that the best multiplier to use for our UV_A sensor output is 2.69. This comes remarkably close to the factors discussed above.
This factors seems best for sun-heights between 20 and 40 degrees above horizon; higher sun-positions yield a slighly smaller calibration factor.
As the intercomparison study with the Umweltbundesamt is the most adequate for the
moment, we suggest:
Use 2.69 as the necessary multiplier to convert the stored UV_A data
into total irradiant power (W/m2 in [320 ..400nm] range, horizontal surface)
If one sticks to relative measurements, i.e. uses the UV_A output just to compare different days or periods at Diekirch to each other, no correction is needed. Peak values comparison certainly will be the most reliable to do.
2.2. Interpreting the Delta_T UV_A readings: state of
knowledge March 1997
The preceding lines represented our state of knowledge end 1995. Starting mid-February
1996 a very precise Solar-Light UVA sensor has been added to the station. All checks
pointed to a multiplier of 10 for all light conditions. This multiplier has been
programmed the 26 February 1996 into the conversion algorithms done during logging,
so that the stored UV_A readings do now very well agree with those of the precise
Solarlight UVA_Biometer.
3.1. The UV_B data: state of knowledge: end 1995
As stated in README.TXT, the relative spectral sensitivity response curve of the UV_B
sensor is an almost symetric bell curve, which extends from 280nmm to 360nm (remember that
the domain usually defined as the UV_B range is 280 to 319nm) and peaks at 313nm.
The solar spectral curve varies over several orders of magnitude in the 280 to 319nm interval (the UV_B region). The hypothesis of an uniform power distribution can not be applied in this case.
Based on the same curve of the solar spectrum as before, one finds this:
EFF = 36.59/9.877 = 3.705
CALIBRATION_FACTOR = 1/3.705 = 0.27
An example:
The UV_B sensor output of the LCD station is 4 W/m2; the true irradiant UV_B power in the [280..319nm] region on a horizontal surface is 4 * 0.27 = 1.08 W/m2
The same statement concerning relative UV_B measurements as that made in the UV_A chapter also applies here.
3.2. The UV_B data: state of knowledge: Mrach 1997
Intercomparisons with the precise Solar Light UVB_Biometer have shown that correct
measures of the effective UVB irradiance can be computed out of the readings of the
Delta_T UVB sensor by applying a parabolic calibration curve. Actually for good results,
one has to treat seperately periods of low irradiance and temperature and periods of
summertime. Please do read the paper A second calibration
study .. .
4. The UV_B Biometer
An UV_B sensor measuring the biologically effective UV_B irradiance was installed in May 1995 (Model: Solar Light Company 501A). This broadband sensor has a spectral sensitivity which closely matches that of the CIE standard curve; this means that this sensor reacts as does the skin of a "standard" white-skinned inhabitant of the Northern Hemisphere which was not exposed to the sun or other UV sources for a month. The sensor output corresponds to a mean_erythemal_dose_per_hour, and is given in [MED/h]:
1 MED = 250 [J/m2] = minimal dose to induce light erythema (=sunburn) (manufacturers in white-skinned people not exposed to sunlight for the whole preceeding month (manufacturers definition)
1 MED/h = 0.06944 [W/m2 effective irradiant UV_B power]
Comment:Initially, the definition of the manufacturer 1 MED = 210 J/m2 was used.
It has been replaced by the German "standard" od 1 MED = 250 J/m2
(end of comment).
The output of the logger is given in milli-MED/h [mMED/h] for logger- specific reasons.
To compute the maximal exposition-time to sunlight (under the above mentioned conditions) one should divide the mMED/h value by 1000 and than take the inverse.
Example:
The UVB-Bio sensor shows 2500 mMED/h;
maximal exposition time is 1/(2500/1000) = 0.4h = 24 min.
This very precise sensor has an internal temperature stabilization; internal temperature should be maintained close to 25 degrees Celsius. The signal UVB_Tin monitors this temperature.
5. General conclusions:
The UV_A and UV_B sensors used at the LCD meteorological station are broadband devices. Making relative comparisons is easy, but getting meaningful and reliable absolute values from these devices can be a tricky affair.
A first tentative yields two multipliers to get the approximate total irradiant UV_A and UV_B power in W/m2 from the output of the sensors. This represented our state of knowledge end 1995, and was based on assumptions on the spectral composition of natural sunlight in Germany, at noon.
When precise Solar-Light UVA and UVB sensors were available for comparison, we found that
a multiplier of 10 applied to the readings of the Delta_T UVA sensor gives good results.
The raw readings of the Delta_T UVB sensor can be converted into meaningful effective UVB
irradiances by applying a parabolic function. Depending on the season (summer or
not-summer), a different parabola must be used. We would be grateful for every suggestions
and remarks concerning this problem.
Francis Massen, LCD francis.massen@ci.educ.lu
Nico HARPES; Radiation Protection Office, Luxembourg; fax: (352) 45 47 94
World-Wide-Web server: www.restena.lu/meteo_lcd/
Acknowledgments to Mr. Markus Wallasch, Umweltbundesamt, Zweigstelle Offenbach, for his
very valuable help.
Back to Home-Page of Meteo_LCD