Francis Massen and students of the LCD(*)
file:
short_o3.html
version: 1.0
date: 15 Dec 98
Summary: |
Contents:
1. [O3] and [NO] in the morning hours
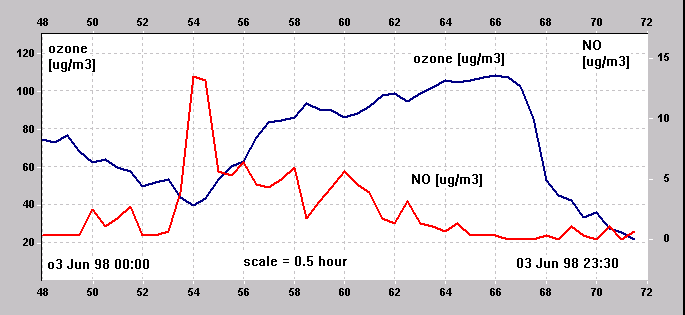
In the morning hours, we typically have a distinctive NO peak, like shown in the following figure:
|
This [NO] peak located at point #54 (which corresponds to 06:00 UTC) coincides with a local minimum of [O3].
Common scientific knowledge tells us that: [O3] = k * [NO2]/[NO] (Marsili-Libelli, 1994), which means that high [NO] values should correspond to low [O3]. Our graph seems to validate this rule.
The NO emissions could be caused by an increased morning hour traffic (rush hour of people driving to their job place between 04:00 and 07:00 UTC, which corresponds to 06:00 - 09:00 local summer time). A short statistical analysis on the 3 months June to August 98 gives us the following results:
| type of days | percentage having a max. [NO] between 04:00 and 07:00 UTC |
| all days | 56 % |
| only working days | 58 % |
| only weekend days | 50% |
The percentages of working days and weekends are very close: the data do not validate the assumption made above, i.e. that the [NO] peak is caused by increased rush hour traffic.
2. Do high or maximal [NO] always correspond to minimal [O3] ?
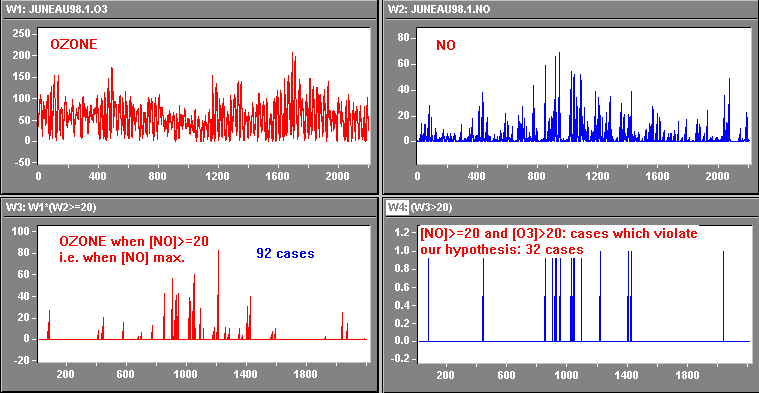
Let us consider only those data where the NO concentration is higher than 20 ug/m3:
this will be our criterium for high or maximal NO values. On the next figure, window W3
shows the 92 cases when [NO]>=20.
From this subset, let us find all those occurencies which violate our assumption, e.g.
that high NO values should go thogether with low O3 values: Window W4 shows
that in 32 cases out of 92, we have high NO and high O3 concentrations,
the criterium for high [O3] being [O3]>20.
The remaining 92-32 = 60 cases (65%) are in accordance with our hypothesis that [O3]
is lowest when [NO] is high
 |
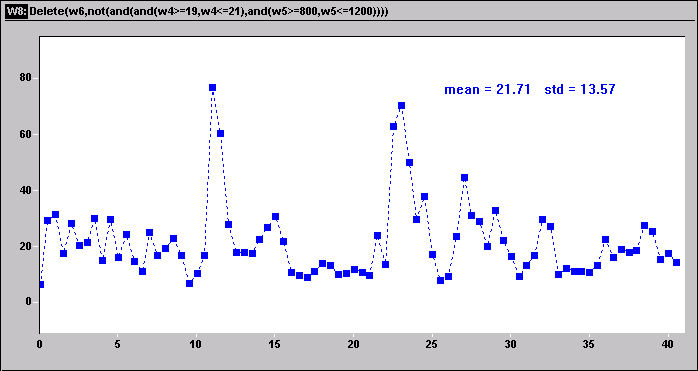
3. Is [O3]/([NO2]/[NO]) constant?
Common scientific knowledge tells us that the concentration of ozone should be proportional to the fraction of the NO2 over NO concentration, i.e.
[O3] = k * [NO2]/[NO]
This means that ([O3]*[NO])/NO2] = k = constant.
The next figure shows, that this is NOT the case, if we take all the data from our 3 months measurement series
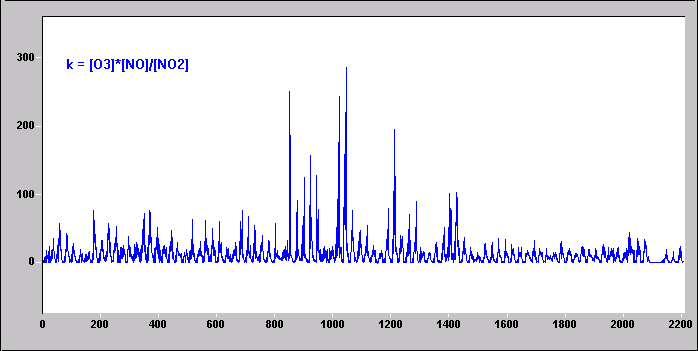 |
This should not come as a surprise, as we know that ozone production is strongly
influenced by available UVB radiation and by air temperature. Let us restrict our
investigation by keeping only data which correspond to near constant UVB and temperature
conditions; we will use a period of rather high UVB irradiance and high air
temperature, and a second with more moderate values of these parameters
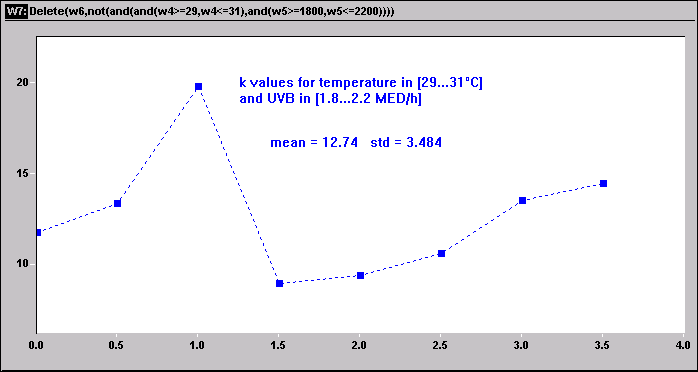
3.1 UVB range [1.8...2.2 MED/h], temperature range [29...31°C]
 |
3.2. UVB in range [0.8...1.2 MED/h] temperature in range [19...21°C]
 |
We see that the range of k-values (neglecting some obvious 'outliers' in the last figure) is much more restricted than in the general case: this could be a confirmation of our hypothesis that k depends on temperature and UVB conditions. For the moment, we will not speculate on the fact that a high UVB and temperature situation seems to correspond to low k values
References:
Marsili-Libelli, St.- Simplified Kinetics of tropospheric ozone. Ecological Modelling 84
(1996) p. 233-244
All computations and graphs made by DADiSPSE, the free student edition of the DADiSP software by DSP Corporation.
Authors:
Forman M., Huss Cl., Mousty K., Mousty T., Müller L., Scheller T., Schneider P.,
Schweitzer D., Tock P., Wolff M., and Francis
Massen, all from the Lycée Classique Diekirch
back to the home page of meteo_lcd