| A short note on meteoLCD CO2 measurements |
|
short_note_co2.html
version 1.01 09 Dec 2006
Please read these comments before using meteoLCD CO2 data for longtime trend analysis!
1. The history of meteoLCD CO2 measurements
meteoLCD, a station located in a semi-rural environment, became operational in April 1996, with more or less reliable continuous CO2 measurements from March 1997 on (see the news) .
The instruments used up to Feb. 2002 were the Gascard and the Guardian II sensors from Edinburgh Sensors Ltd.(the links are for the actual "plus" versions). The range of the Gascard was 2000 ppm, that of the Guardian II 3000 ppm; accuracy according to specifications 2%; both are NDIR sensors based on a nearly identical electronic circuit board. There were quite a lot of intermittant problems with these sensors (zero drift, excessive span variations, several membrane-pump malfunctions) when used in a permanent 24h/24h mode. Nevertheless the CO2 series do show the usual daily variations, but are too patchy for longtime trend analysis, and should not be relied upon for a good background concentration.
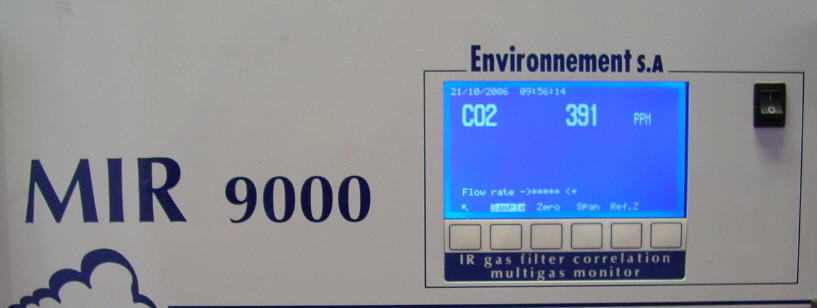
Starting 28 Feb. 2002, a new EPA compliant professional instrument (also a NDIR device), the MIR 9000 from Environment SA was used for CO2 measurements. The specifications are:
| range used: | 0-500 ppmV |
| span and zero drift: | +/- 2% of full scale in 30 days |
| resolution | 0.1 ppmV |
The instrument is recalibrated using span and zero gas ( or CO2 free dry air) about every 3 weeks, and a general overhaul done by Envitec SA four times a year. The span gas used is from Praxair: bottle concentration is 496 ppmV, with an incertitude of +/- 2%; the same bottle has been in use since 30 June 2003. An automatic zero check and zero adjustment is done every 24 hours during the night.
Zero drift has been found to be practically nil, and is in fact not a problem as the sensors is built to make regular zero autocalibrations. The span-factor K does indeed vary from check to check, and is changed as needed. Here are some examples from the current year 2006
| Date | K- factor | % change |
| 16/09/06 | 1.072 | +2.5 |
| 31/07/06 | 1.046 | +2.4 |
| 26/05/06 | 1.021 | -2.8 |
| 17/03/06 | 1.050 | 0 |
| 02/02/06 | 1.050 | 0 |
| 17/01/06 | 1.050 |
2. What do the data tell us?
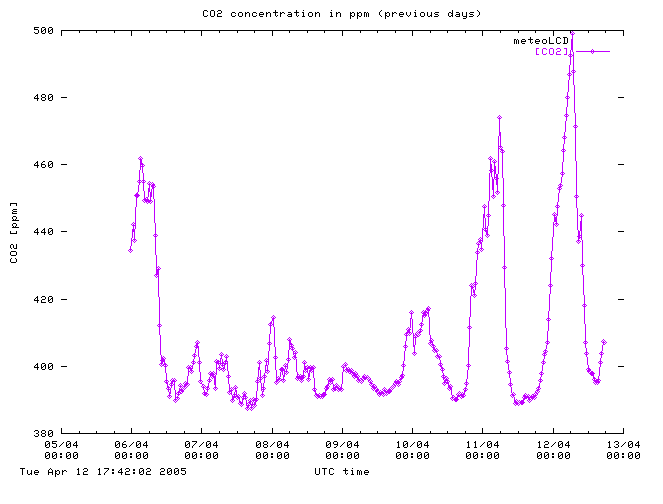
One of the main reasons for meteoLCD CO2 measurements was to deliver near-live CO2 data, and not only daily, seasonal or worse, yearly averages. In CO2 discussions, the considerable magnitude of daily variations is often unknown, as are the typical night/day patterns during vegetation poor winter time and summer time with is strong photosynthesis; there is quite a difference between the real observational data and the ubiquitous yearly Mauna Loa curves! Making long-time trend analysis on data from a not isolated station is feasible, but risky. Even in a semi-rural environment we have daily traffic peaks from the commuters, and at least two different wind regimes (west and east) according to the meteorological conditions.
3. Conclusion
Our best data series start in Feb. 2003; daily CO2 patterns are clearly visible and show the influence of night and morning inversions, as well as the influence of the biosphere (an online paper on this is in the works). Caution should prevail when using the data to document the global positive CO2 trend.