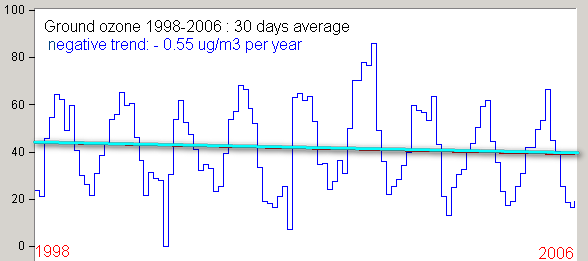
("bad ozone")
mean : 41.13 ug/m3
stdev: 34.50
mean of daily max = 76.5 +/- 38.4
daily max. variation = - 4 (1998-2006)
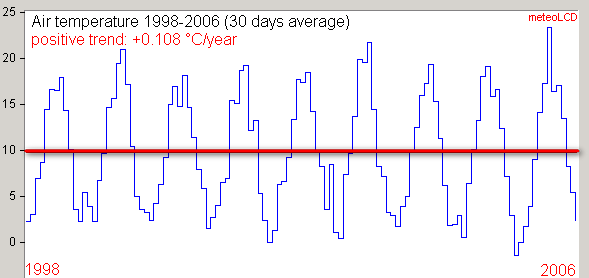
mean : 10.25 °C
stdev: 7.61
As the sensor has been moved several times, this trend should be taken with caution!
Range (DTR) [°C]
DTR = daytimeMAX-nighttimeMIN
daytime = 08:00 - 20:00 UTC
DTR mean : 7.81 +/- 4.58
daytimeMAX mean: 14.37 +/- 8.34
trend: +0.15 °C/year
nighttimeMIN mean: 6.58 +/- 6.03
trend: +0.03 °C/year
If DTR is computed as the difference between the diurnal (i.e. 24 hours) Max and Min the trend is +0.08 °C/year

("good ozone")
positive trend + 3 DU/year
mean : 323.2 DU
stdev : 12.4 DU

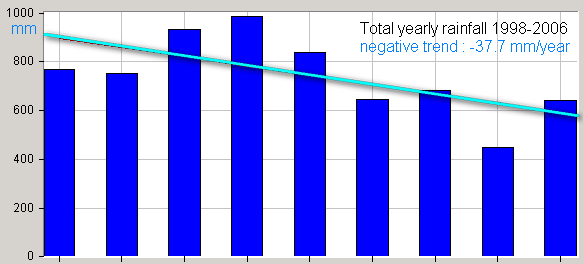
mean : 744.4 mm
stdev : 163.7 mm
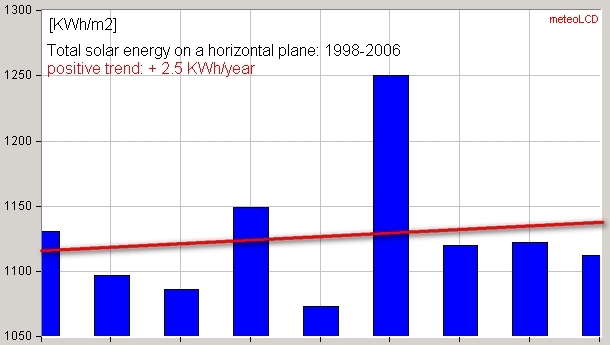
mean: 1127 kWh/m2
stdev: 52 kWh/m2
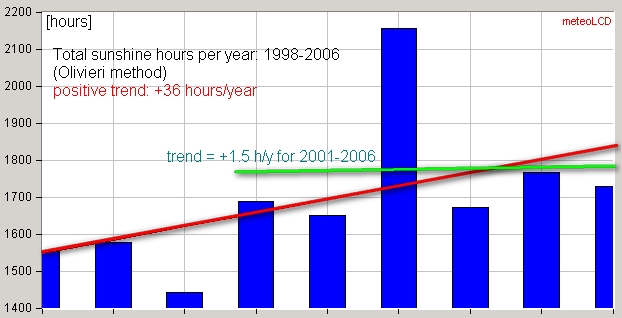
(derived from pyranometer data by Olivieri's method)
mean: 1655 hours
stdev: 200 hours
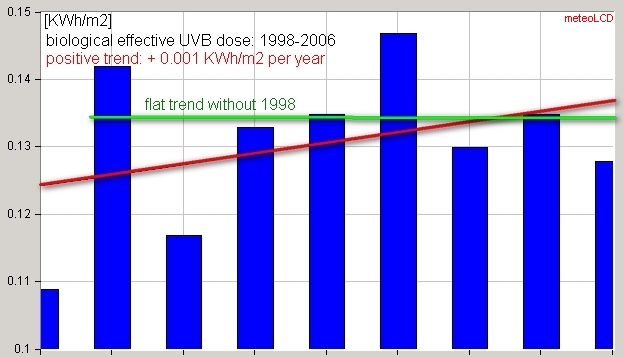
mean: 0.131 eff. kWh/m2
stdev: 0.012 eff. kWh/m2
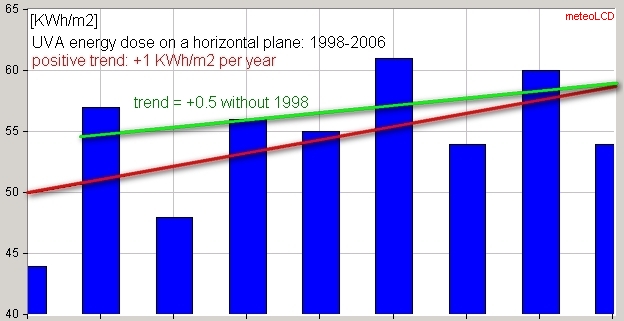
mean: 54 kWh/m2
stdev: 5 kWh/m2
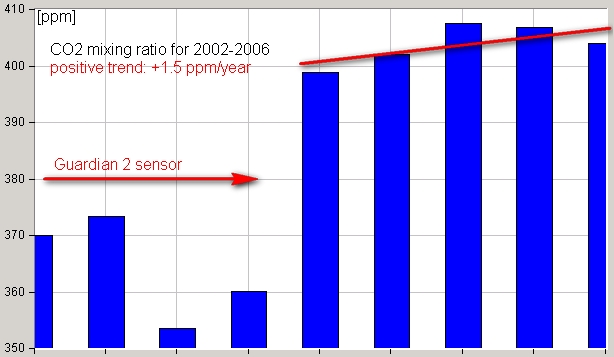
The 1998-2001 data are too unreliable to be retained.
For 2002-2006:
mean: 403.8 ppm
stdev: 3.6 ppm
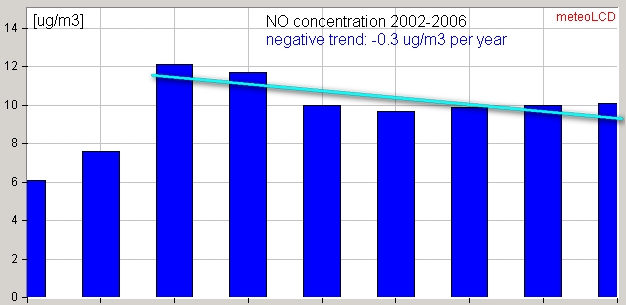
The 1998-1999 data are too unreliable to be retained.
For 2000-2006:
mean: 10.5 ug/m3
stdev: 1.0 ug/m3
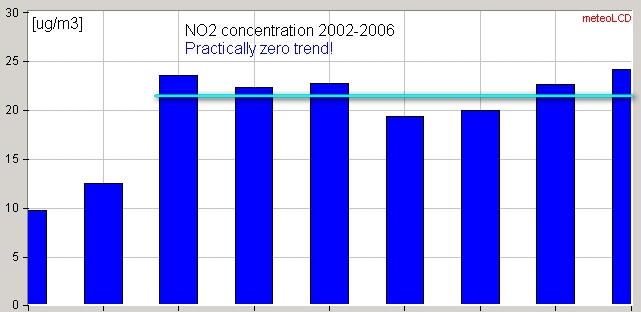
The 1998-1999 data are too unreliable to be retained.
For 2000-2006:
mean: 22.1 ug/m3
stdev: 1.8 ug/m3