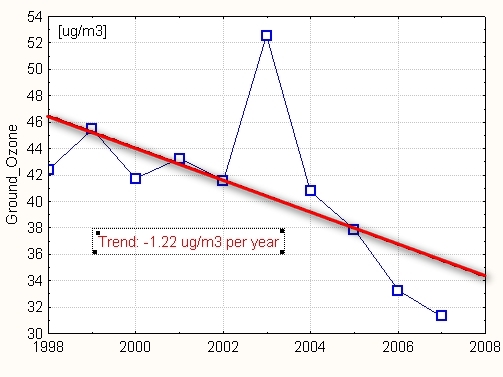
("bad ozone")
negative trend: -1.22 ug/m3 per year
mean : 41.0 ug/m3
stdev: 6.0
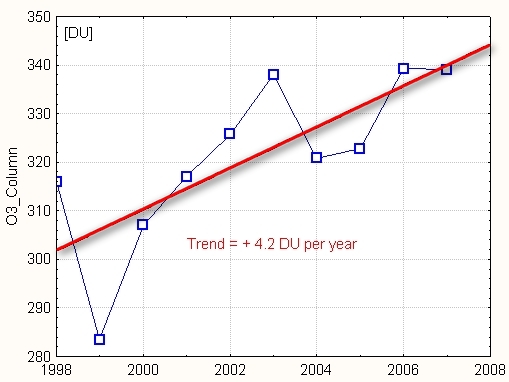
("good ozone")
positive trend: + 4.2 DU per year
calibration
factor applied if needed!
mean : 320.9 DU
stdev : 17.0 DU
See [4]
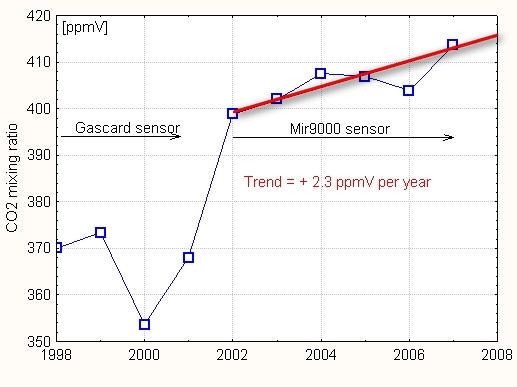
The 1998-2001 data are too unreliable to be retained
for the trend analysis.
For 2002-2007:
positive trend: + 2.3 ppmV per year
mean: 405.5 ppmV
stdev: 5.1 ppmV
See this figure
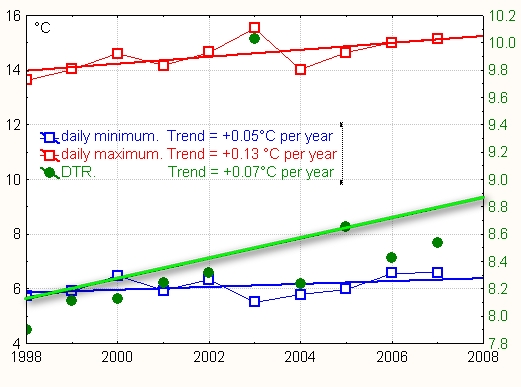
positive trend: + 0.07 °C per year
mean : 10.34 °C
stdev: 0.34
As the sensor has been moved several times, this trend should be taken with caution!
Increase is smallest from 2006 to 2007.

Range (DTR) [°C]
positive trend: + 0.07 °C per year (right
axis)
mean: 8.46 °C
stdev: 0.59
Note that daily maximum rises faster than daily minimum. DTR increase
could be related to increasing insolation (sunshine duration)
See [5]
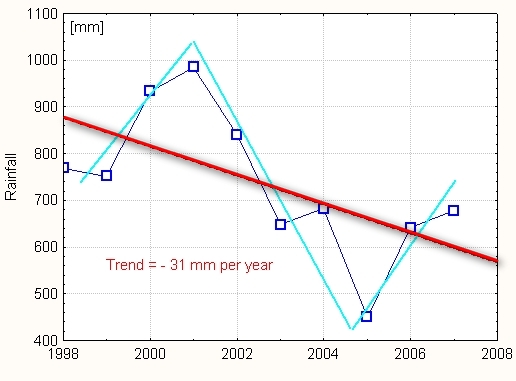
negative trend: - 31 mm per year
mean : 737.8 mm
stdev : 155.8 mm
Note zig-zag
pattern!
Rainfall in Diekirch may be very different from
that at the Findel airport:
ex: 2007:
Findel = 1032 mm, Diekirch = 678 mm
positive trend: + 0.06 kWh/m2 per year
mean: 1123 kWh/m2
stdev: 50 kWh/m2
Note practically flat trend!
Would be slightly negative (-0.8)
without heat-wave year 2003.
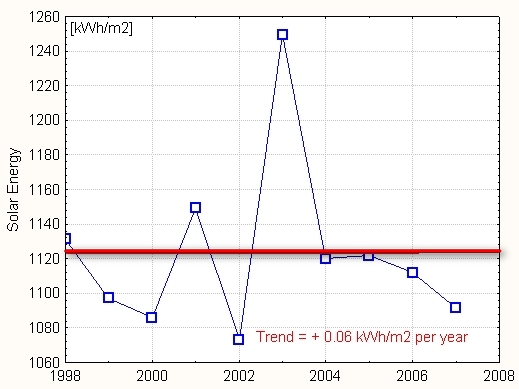
(derived from pyranometer data by Olivieri's method)
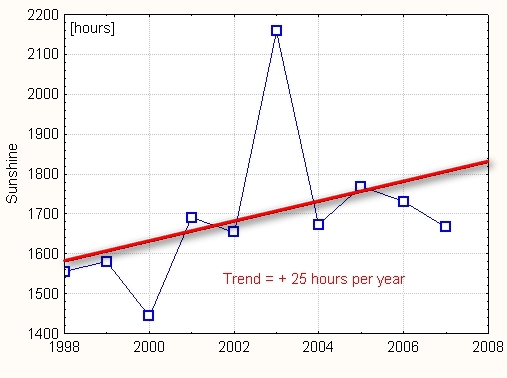
positive trend: + 25 hours per year
mean: 1692 hours
stdev: 188 hours
Trend would be +22 hours/year without
heat-wave year 2003.
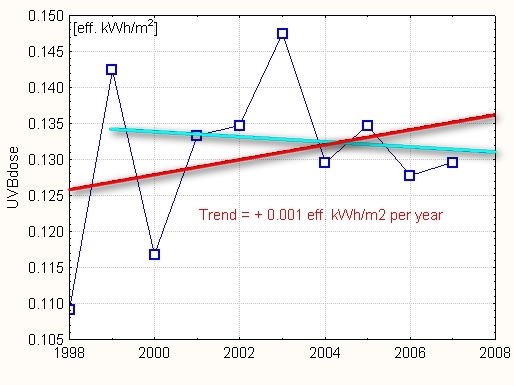
positive trend: + 0.001 eff. kWh/m2 per year
mean: 0.131 eff. kWh/m2
stdev: 0.011 eff. kWh/m2
Trend would be negative (-0.0003) without year 1998.
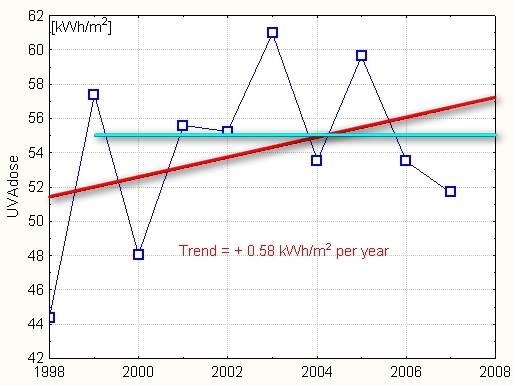
mean: 54 kWh/m2
stdev: 5 kWh/m2
Trend would be flat without year 1998.
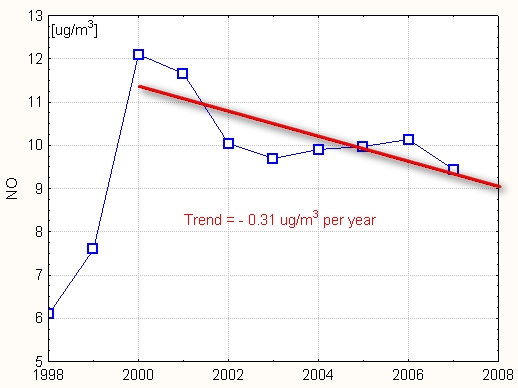
The 1998-1999 data are too unreliable to be retained.
For 2000-2007:
negative trend: -0.31 ug/m3 per year
mean: 10.4 ug/m3
stdev: 1.0 ug/m3
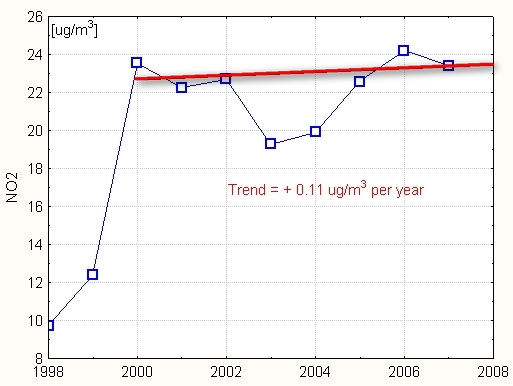
The 1998-1999 data are too unreliable to be retained.
For 2000-2007:
positive trend: + 0.11 ug/m3 per year
(nearly flat)
mean: 22.2 ug/m3
stdev: 1.8 ug/m3