("bad ozone")
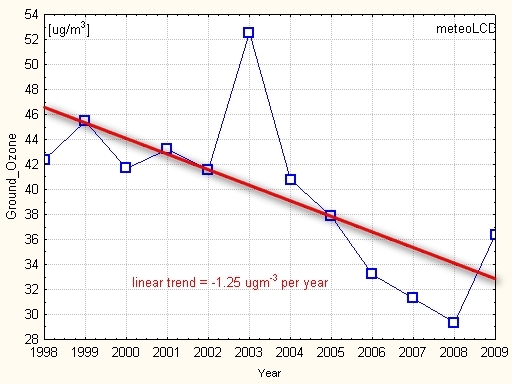
negative trend: -1.4 ug/m3 per year
mean : 39.7 ug/m3
stdev: 6.5
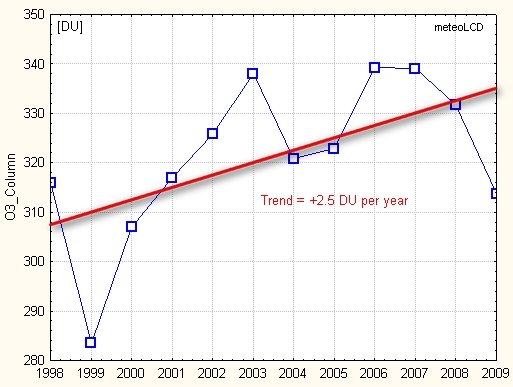
("good ozone")
positive trend: +2.5 DU per year
(+1.4 without year 1999; Uccle [16] gives +1.25 for the 1990-2008 period)
calibration
factor applied if needed!
mean : 321.2 all 2009 values adjusted for
stdev : 15.9 recalibration, effective 15Sep09
See [4] [8]
([8] shows strong
positive trend starting 1990 for
latitudes 45°-75° North, Europe):
See also recent EGU2009 poster [16].
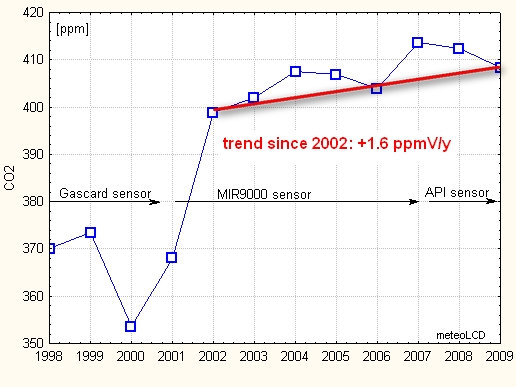
The 1998-2001 data are too unreliable to be retained
for the trend analysis.
For 2002-2009:
positive trend: + 1.6 ppmV per year (less than the previous one which was
2.15)
mean: 402.4 ppmV
stdev: 5.0 ppmV
See this figure
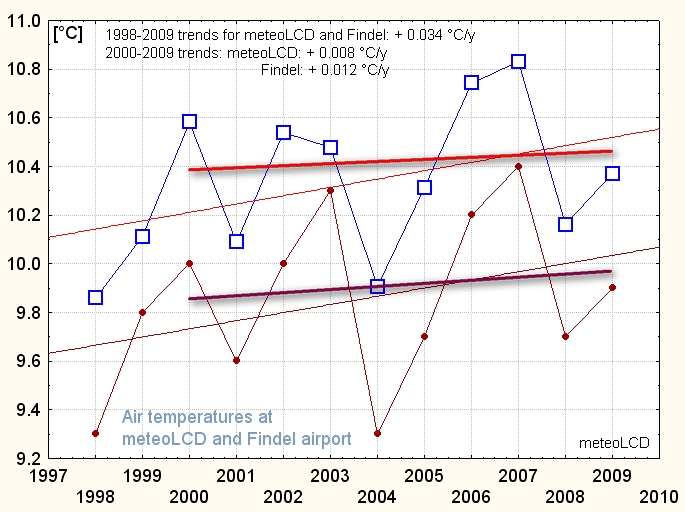
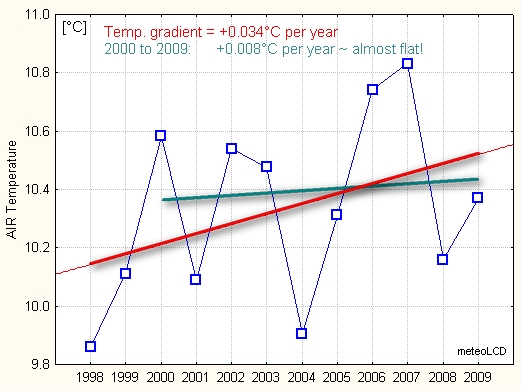
positive trend from 1998 to 2009: + 0.03 °C per year
mean : 10.33 °C 2000
to 2009: 10.40°C
stdev: 0.31
0.29
As the sensor has been moved several times, this trend should be taken with caution!
Practically no warming from 2000 to 2009:
(meteoLCD: 0.075°C/decade)
Findel airport: 0.115 °C/decade (UHI?)
(meteoLCD/Findel plots
here and here)
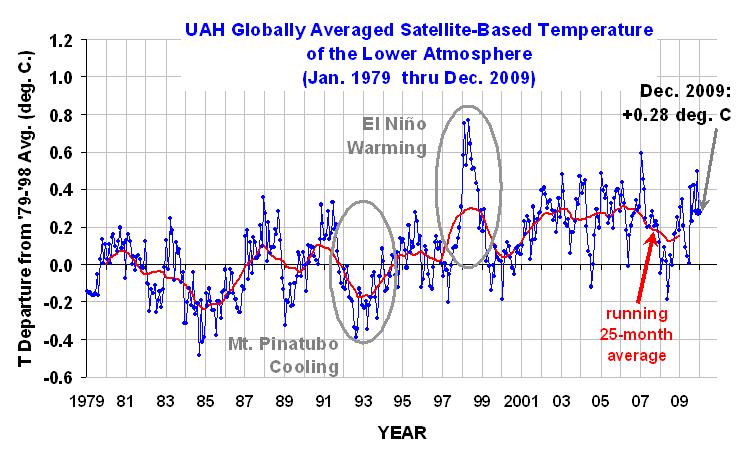
UAH trend for the past 10 years:
0.05 °C/decad. [12]
Highest decadal Central England warming trend from 1691 to 2009:
+1.86°C/decade for 1694-1703!
See also [15]
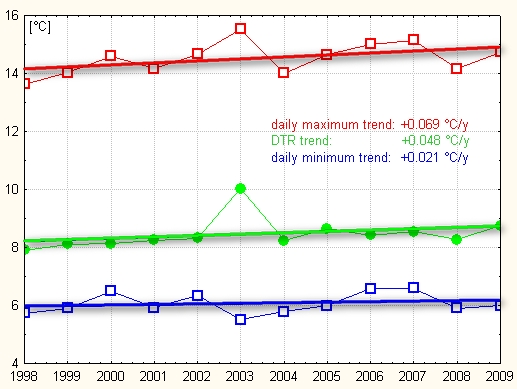
Range (DTR) [°C]
DTR = daily max - daily min temperature
positive trend: + 0.05 °C per year
mean: 8.47 °C
stdev: 0.55
Note that daily maximum rises faster than daily minimum! The increase in
DTR is also documented
here!
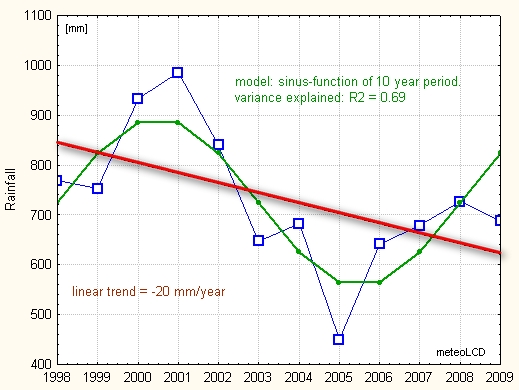
negative trend: - 24 mm per year
mean : 732.7 mm
stdev : 141.6 mm
Rainfall in Diekirch may be very different from that at the Findel airport
!
Findel: 890 mm
Note the good fit by a simple sinus function of period 10 years (best fit); rainfall
changes may be periodic and a linear trend may well be meaningless!
[6] gives medium term periods of 10 to12 years for
the region from England to eastern Germany.
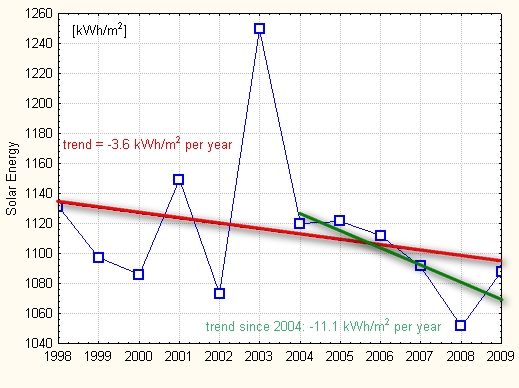
negative trend: -3.6 kWhm-2 per year
and -11.1 kWhm-2y-1 since 2004 (end of solar cycle #23),
which should cause a cooling of 0.56 °C according to [15]:
meteoLCD observations show a warming of 0.056 °Cy-1 ~ flat
trend.
mean: 1114 kWhm-2
stdev: 50 kWhm-2
[14] finds 0.7 Wm-2y-1 for West-Europe 1994-2003 , meteoLCD +1Wm-2y-1 for 1998-2003.
see also [9]
(derived from pyranometer data by Olivieri's method)
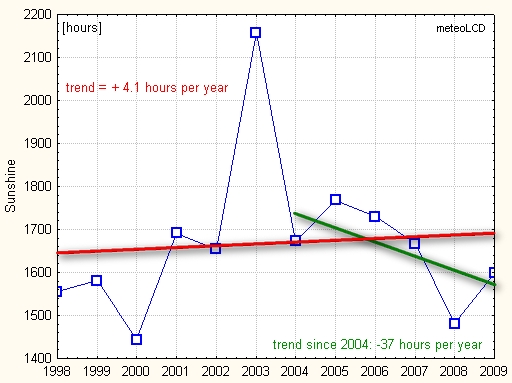
positive trend: + 4 hours per year
mean: 1677 hours
stdev: 195 hours
Note strong negative trend from 2005 to 2009.
Findel airport (Campbell-Stokes): 1880 hours
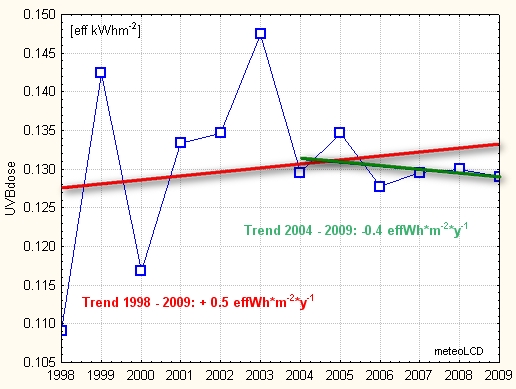
Slight positive trend: + 0.5 eff.Wh/m2 per year
mean: 0.130 eff. kWh*m-2
stdev: 0.010 eff. kWh*m-2
Note
negative trend of -0.4 effWhm-2y-1 from 2004 to 2009,
in accordance to the dimmimg measured by
the pyranometer and the UVA sensor.
So this dimming is confirmed by 3 independant instruments!
See [10]
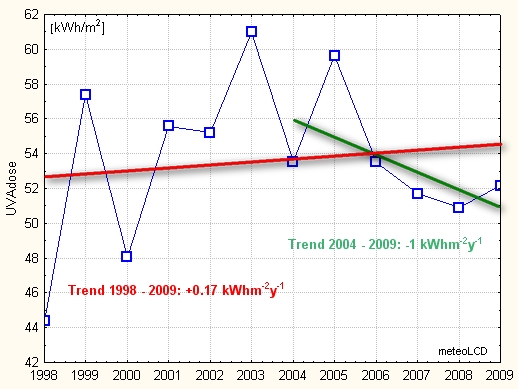
slight positive trend: + 0.2 k Whm-2 per year
mean: 54 kWh/m2
stdev: 5 kWh/m2
Note strong negative trend of -1 kWhm-2y-1 from 2004 to 2009, in accordance to the dimmimg measured by the pyranometer.
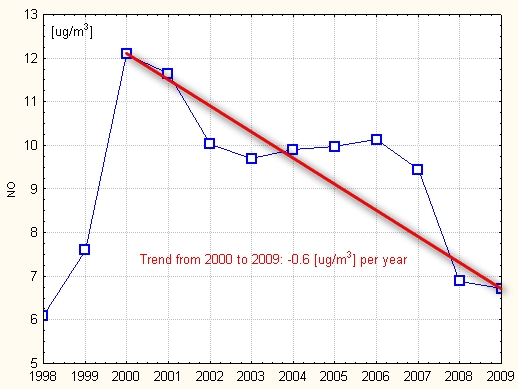
The 1998-1999 data are too unreliable to be retained.
For 2000-2009::
negative trend: -0.6 ug/m3 per year
( = 44% reduction relative to 2000)
mean: 9.7 ug/m3
stdev: 1.7 ug/m3
see [11] which gives ~30% reduction from 1990 to 2005 for the EU-15 countries.
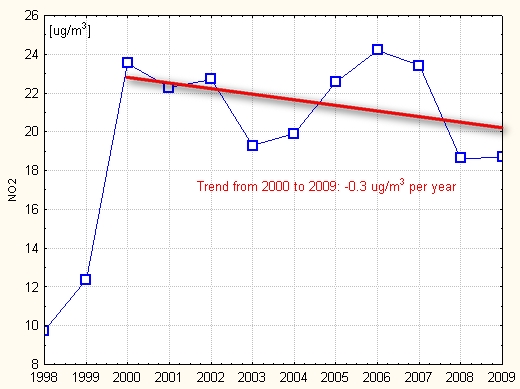
The 1998-1999 data are too unreliable to be retained.
For 2000-2009:
negative trend: - 0.5 ug/m3 per year
mean: 21.5 ug/m3
stdev: 2.2 ug/m3