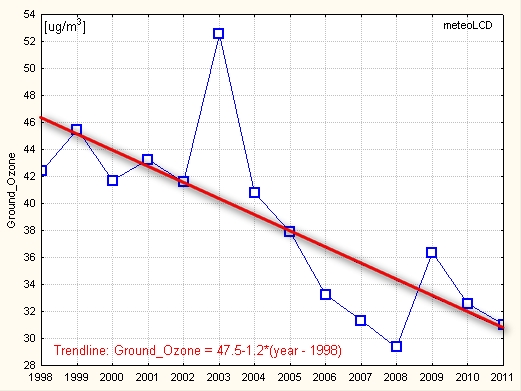
("bad ozone")
negative trend: -1.2 ug/m3 per year
mean : 38.5 ug/m3
stdev: 6.6
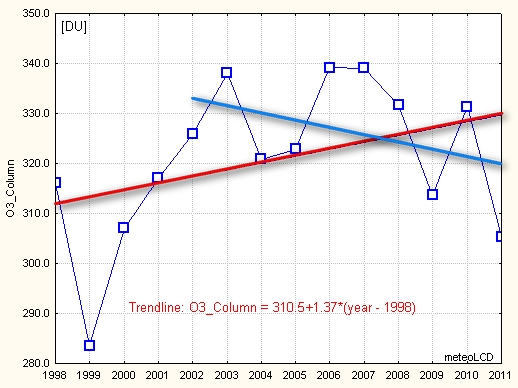
("good ozone")
positive trend: +1.4 DU per year
(Uccle gives +0.95 for the 1998-2010 period) (see also [16])
Calibration factor applied if needed!
Uccle data from WOUDC (stat.53, Brewer#16)
mean : 320.8 (Uccle: na )
stdev : 15.5 (Uccle: na )
Small negative trend of -1.5 DU/year since 2002.
See [4] [8]
([8] shows strong
positive trend starting 1990 for
latitudes 45°-75° North, Europe):
See also recent EGU2009 poster [16].
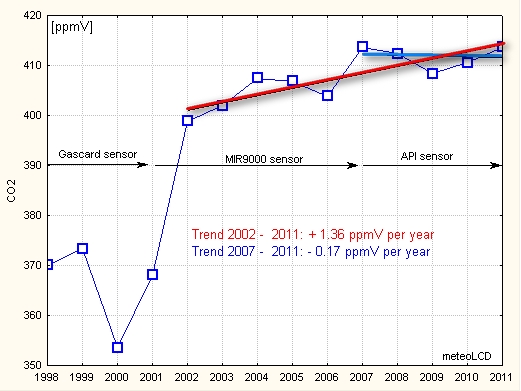
The 1998-2001 data are too unreliable to be retained
for the trend analysis.
For 2002 - 2011:
positive trend: + 1.4 ppmV per year
For 2007 - 2011:
flat trend:
- 0.17 ppmV per year !
mean: 407.8 ppmV
2007 to 2011: 411.7 ppmV
stdev: 5.0
2.3
See this figure
for a comparison between meteoLCD and Mauna Loa CO2 trends.
The right picture shows the asymptotic CO2 values
(CO2wind)
derived from the model published in [21] .
The blue upper curve shows the yearly mean
values at Diekirch; the middle red curve the
asymptotic CO2 values that would exist if wind velocity was infinite, and
the lower green curve the yearly averages at
Mauna Loa, augmented by +1.8 ppm to respect the latitudinal gradient of
approx. 0.06 ppm per degree.
The asymptotic mixing ratios are reasonably close to those of Mauna Loa
(adjusted); the yearly trends calculated from the mean and asymptotic values
at Diekirch are close (1.36 and 1.31 ppm*y-1). They are
visibly lower than the Mauna Loa yearly gradient.
See also [25]

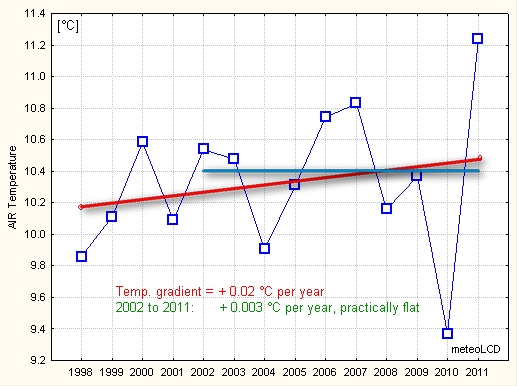
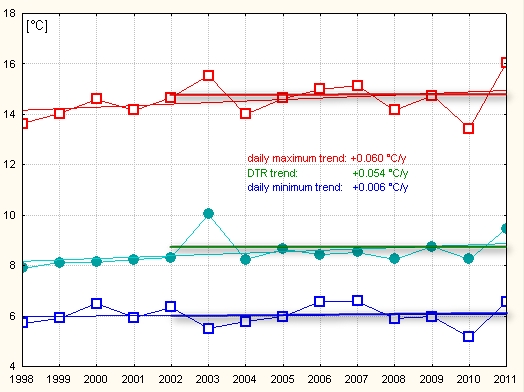
Trend from 1998 to 2010: +0.024 °C per year
mean : 10.33 °C 2002
to 2011: 10.39°C
stdev: 0.45
0.52
The sensor has
not been moved since 2002!
Essentially flat trend from 2002 to 2011:
meteoLCD: + 0.03°C/decade
CRU (Hadcrut3) trend for 2001-2010:
0 0°C/decad. [18]
Highest decadal Central England warming trend from 1691 to 2009:
+1.86°C/decade for 1694-1703!
See also [15]
Range (DTR) [°C]
DTR = daily max - daily min temperature
positive trend: + 0.05 °C per year
mean: 8.52 °C
2002 to 2011: all trends flat!
stdev: 0.57
Note that for 1998 -2011 daily maximum rises faster than daily minimum! The increase in DTR is also documented
here!
Since 2002, all three parameters have trends lower than 0.003 °C/y, i.e.
these trends lines are flat.
Trend from 1998 to 2011: - 24 mm per year
mean : 702.2 mm
2002 to 2011: 639.1 mm
stdev : 146.2 mm
114.9 mm
Rainfall in Diekirch may be very different from that at the Findel airport
! Diekirch = 505, Findel = 700 mm
Best simple model: Sinus function of 7 years period with time dependant
amplitude (R2 = 0.45). Model suggest rising precipitations during the
next years.
[6] gives medium term periods of 10 to12 years for
the region from England to eastern Germany.
Note: Rainfall readings are possibly too low, as there were several occasions of sensor blocked by bird droppings.

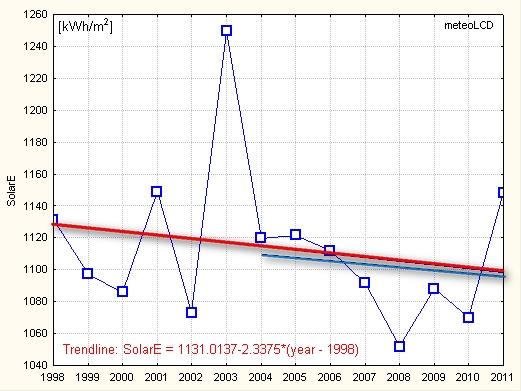
mean: 1113.5 kWhm-2
stdev: 48.8 kWhm-2
Negative trend: -2.3 kWhm-2 per year
and -2 kWhm-2y-1 since 2004 (solar cycle #23
terminates December 2008).
This last period should cause a cooling of
0.06 °Cy-1 , assuming no feedback. ([19]). The meteoLCD observations show a
warming of
0.03°Cy-1 (from linear regression).
Our data suggest: ΔT =- 0.13 * ΔF
where ΔT = temperature change per year in °C
ΔF = change in solar irradiance per year in Wm-2
assuming solar energy being the sole driver. Thus the previous agreement with the "fast process sensitivity k1s" given by
Scafetta [20] does not exist anymore. (see
Addendum 1)
[14] finds 0.7 Wm-2y-1
for West-Europe 1994-2003 , meteoLCD +1 Wm-2y-1 for
1998-2003.See also [9]
(derived from pyranometer data by Olivieri's method)
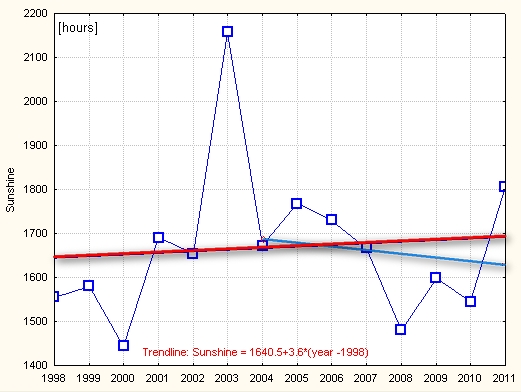
Trend: + 3.6 hours per year
mean: 1668 hours
stdev: 175
Note negative trend from 2004 to 2011:
- 9.1 hours per year.
See paper [23] by F. Massen comparing 4 different methods to compute sunshine duration from pyranometer
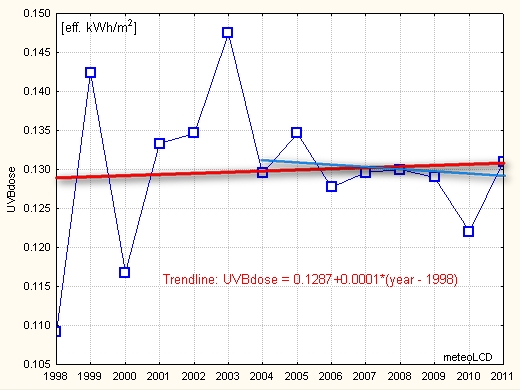
Practically flat trend line for the whole period.
mean: 0.130 eff. kWh*m-2
stdev: 0.010 eff. kWh*m-2
Note small negative trend of - 0.6 eff. Whm-2y-1 from 2004 to 2011,
in accordance to the dimmimg measured by
the pyranometer over the same period..
Dimming is confirmed by both pyranometer and UVB sensor
See [10] and [22] (poster finds slight positive trend in June (+2%) and negative trend in August (-1%), no trend for other months, for period 1991 to 2008)
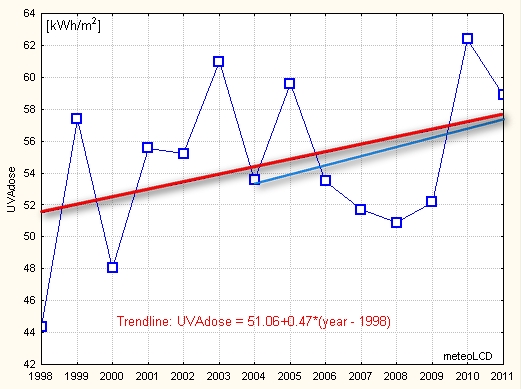
Positive trend: + 0.4 k Whm-2 per year, essentially caused by the first and last readings.
mean: 54.59 kWh/m2
stdev: 5.05 kWh/m2
Note exceptional high 2010 reading causing a visible positive trend of +0.5 kWm-2y-1 : This 2010 reading should be taken with caution, as it leads to a trend opposite to that of both the total irradiance and the UVB dose (without 2010 data trend would be slightly negative from 2004 to 2011)
(no update to 2011)
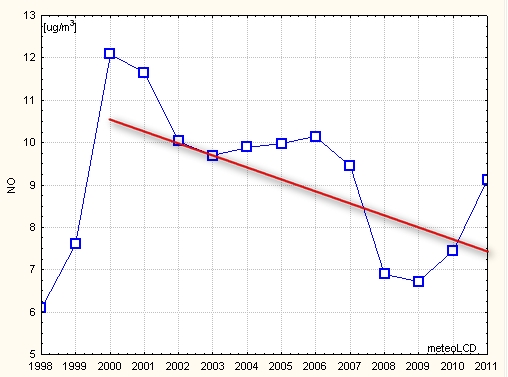
The 1998-1999 data are too unreliable to be retained.
For 2000-2011::
negative trend: -0.3 ug/m3 per year
mean: 9.1 ug/m3
stdev: 1.8 ug/m3
Many (about 25%) missing data in 2011, so this trend and the last data point should be taken with caution!
see [11] which gives ~30% reduction from 1990 to 2005 for the EU-15 countries.
The 1998-1999 data are too unreliable to be retained.
For 2000-2011:
negative trend: - 0.4 ug/m3 per year
mean: 19.8 ug/m3
stdev: 4.2 ug/m3
Many (about 25%) missing data in 2011, so this trend and the last data point should be taken with caution!

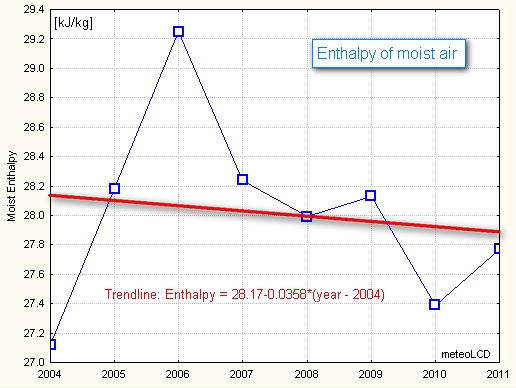
See [24] on how the energy contentof moist air is
calculated. Several authors, as Prof. Roger Pielke Sr. insist that air
temperature is a poor metric for global warming/cooling, and that the energy
content of the moist air and/or the Ocean Heat Content (OHC) are better.
Mean yearly moist enthalpy values are very close, but they may change from
close to zero up to 60 Kj/kg during a year. Moist enthalpy can not be
calculated for temperatures <= 0 °C.
2004 - 2011: mean = 28.01
stdev = 0.64
Trend is slightly negative: -0.036 KJ/kg per year which is consistent with
the trend in solar energy and UVB dose..
