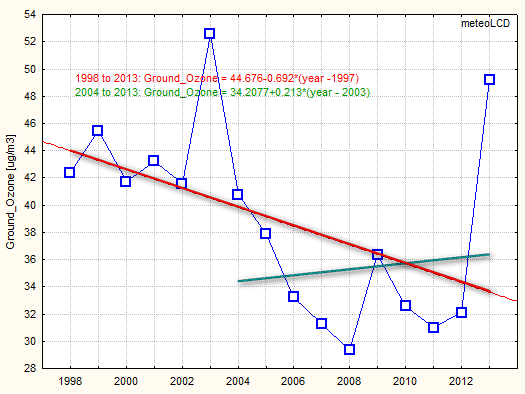
("bad ozone")
From 1998 to 2013: negative trend: -0.7 ug/m3 per year
1998-2013 mean
+/- stdev:
38.8 +/- 6.9 ug/m3
Attention: there are about 15% missing data in 2013 due to frequent sensor failures, so the 2013 data point and the 2004-2013 trend line are suspicious!
("good ozone")
Mean +/_std: 320.9 +/- 45.8 DU
positive trend: +1.6 DU per year, -0.1 since 2002
(Uccle gives +0.95 for the 1998-2010 period) (see also [16])
Calibration multiplier to apply if Uccle Brewer #16 is the reference:
1998 to 2007: * 0.95
2008 to 2010: * 1.00
2011 : * 1.06
2012 : * 1.04
2013 : * 1.06 (provisional)
2013 common days measurements results:
Diekirch = 321.6 DU
Uccle DS = 342.0 DU
Uccle data are from WOUDC (stat.53, Brewer#16, provisional as Dec. data not yet available)
1998 to 2012 mean
+/- stdev:
Diekirch: 323.8 +/- 15.5
Uccle.: 328.8 +/- 3.5
(Uccle without 2009/10/11)
See [4] [8]
([8] shows strong
positive trend starting 1990 for
latitudes 45°-75° North, Europe): [27] give +1.32
DU/y at the Jungfraujoch for 1995-2004.
See also recent EGU2009 poster [16].
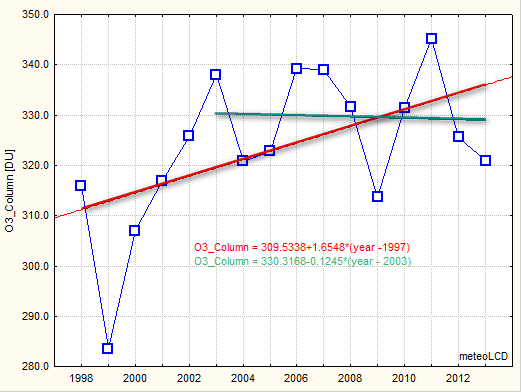
The 1998-2001 data are too unreliable to be retained
for the trend analysis.
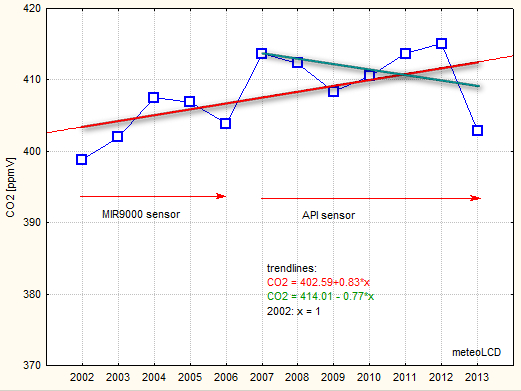
2002 to 2013 mean
+/- stdev:: 408.4 +/- 5.3 ppmV
trend = +0.83 ppmV per year
2007 to 2013 mean
+/- stdev:: 410.9 +/- 4.2 ppmV
trend: - 0.77 ppmV per year !
The sharp plunge and negative trend should be taken with caution;
there was a change in the calibration gas the 21 Jan. and the primary
standard used (600 ppmV) has an accuracy of 1%. All readings <= 370 have
been discarded.
The 2013 average of 402.9 ppmV is close to those measured by the German
stations of Hohenpeissenberg (HPB 400.4, trend +2.5) and Ochsenkopf.(OXK
399.9, trend + 1.67).[34]
The right picture shows the asymptotic CO2 values
(CO2wind)
derived from the model published in [21] .
The blue upper curve shows the yearly mean
values at Diekirch; the middle red curve the
asymptotic CO2 values that would exist if wind velocity was infinite, and
the lower green curve the yearly averages at
Mauna Loa, augmented by +1.8 ppmV to respect the latitudinal gradient of
approx. 0.06 ppm per degree.
The asymptotic mixing ratios are reasonably close to those of Mauna Loa
(adjusted) up to 2012; the yearly trends calculated from the mean and asymptotic values
at Diekirch are noticeably lower (0.83 and 0.88 ppmV*y-1) than
the MLO trend of 2.05.
Compared trends from 2006 to 2012 for EU sites:
Ochsenkopf (OXK): 0.68
Hohenpeissenberg (HPB): 1.68
Diekirch: 1.14
See also [25]
The 2013 CO2 data clearly show the summer-time lows, mostly due to the increased photo-synthesis. The amplitude 2A of the best-fit sinusoidal model is about 12 ppmV. The paper [35] gives an annual swing of ~12 ppmV whereas the Hohenpeissenberg (lat. 47.8°) and Ochsenkopf (lat. 50°) measurements suggest about 20 ppmV. A paper discussed at [36] gives an 2A amplitude of about 12 ppmV at ~5km altitude and 50° latitude North. It seems that the annual swing is increasing since 1960 mostly due to enhanced biosphere activity.


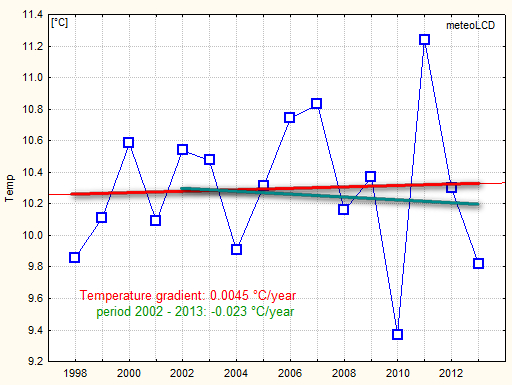
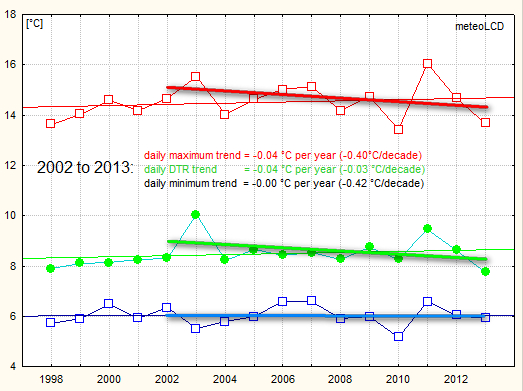
Trend from 1998 to 2013: +0.0045 °C per year, practically flat!
1998 to 2013 mean
+/- stdev::
10.29 +/- 0.45 °C
2002 to 2013:
10.34 +/- 0.50 °C
The sensor has
not been moved since 2002!
Strong cooling trend from 2002 to 2013:
meteoLCD: - 0.23°C/decade
Findel:
-0.46°C/decade
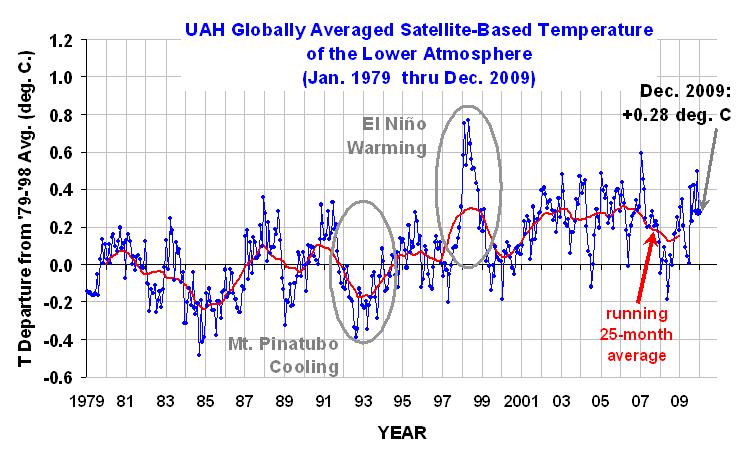
Global NH Land temperature trends:
UAH (satellite) : + 0.03°C/decad [26]
CRU (Hadcrut4): - 0.02°C/decad. [18]
Highest decadal Central England warming trend from 1691 to 2009:
+1.86°C/decade for 1694-1703!
See also [15] (which may be obsolete)
Range (DTR) [°C]
DTR = daily max - daily min temperature
For 2002 to 2013:
Small negative trend: -0.04 °C per year.
Findel DTR trend is -0.05 °C per year
(plot shows rounded numbers)
1998 to 2012 mean
+/- stdev:: 8.48 +/- 0.55 °C
2002 to 2013: daily max trend slightly negative, daily minimum trend
flat, so DTR trend = daily max. trend.!
A fingerprint of global warming is that daily minima increase more than
daily maxima. Clearly the data do not show this!
The BEST data [29] including 2013 are not yet
available.
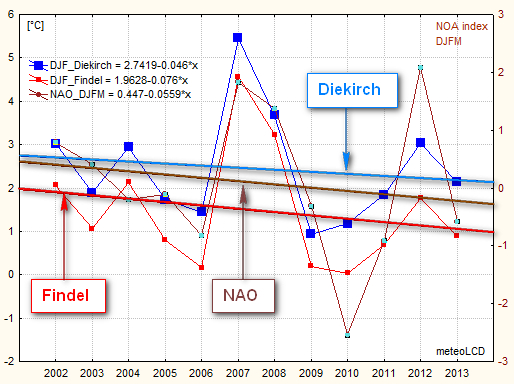
Contrary to what is often suggested in the media, winters are cooling since 2002. The cooling rates per decade are:
Diekirch: -0.46 °C/decade
Findel: -0.76 °C/decade
Germany: -0.94 °C/decade [31] (not on
plot)
The plot shows the mean temperatures of
December (from previous year), January and February. It also shows in
brown (right Y-axis) the NAO index for the months Dec to Mar [32]
The North Atlantic Oscillation clearly
influences our winters; the correlations between the 3 different DJF series
and DJFM_NAO are 0.76, 0.77 and 0.79, all significant at the 5% level. The NAO trend is also negative for the 2002 to 2013 period.
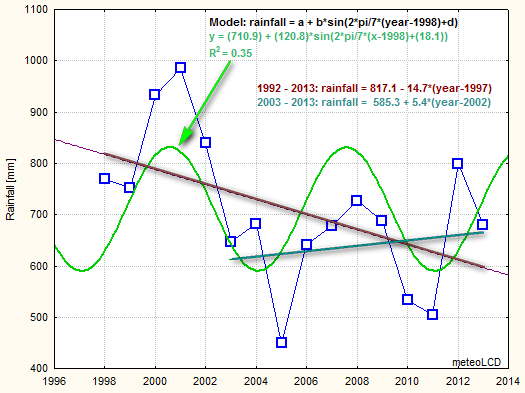
1998 to 2013 mean +/- stdev::mean :
706.9 +/- 143.5 mm .
Negative trend of -14.7 mm/year
2003 to 2012:
653.7 +/- 119.2 mm
Positive trend of +5.4 mm/year
Rainfall in Diekirch may be very different from that at the Findel airport ! Totals for 2013:
Diekirch = 680, Findel = 960, Trier = 791 mm.
Acceptable simple model: Sinus function of 7 years period (R2 = 0.36). Model
more or less correctly reflects rising
and falling precipitation.
[6] gives medium term periods of 10 to12 years for
the region from England to eastern Germany.
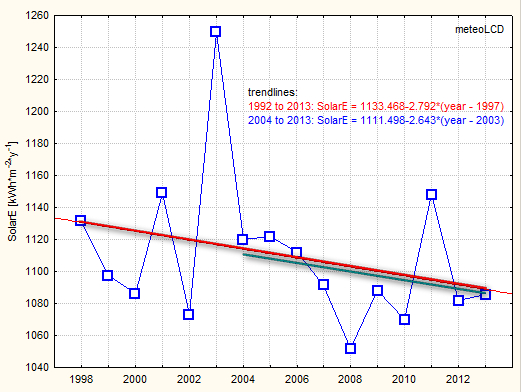
mean
+/ std:: 1109.8 +/-46.5 kWhm-2
Visible negative trends:
1998 to 2013: -2.8 kWhm-2y-1
2004 to 2013: -2.6 kWhm-2y-1
(solar cycle #24 begins Jan. 2009).
According to Scafetta's sensitivity k1s the period 2004 to 2013 should cause a cooling of -0.016
Ky-1 ([20]). The meteoLCD
observations show from 2004 to 2013 a very close cooling of -0.015 Ky-1
, . (see
Addendum 1)
Helioclim satellite measurements show ongoing solar dimming over
Luxembourg for 1985 to 2005 [33] (see
graph)
[14] finds 0.7 Wm-2y-1
for West-Europe 1994-2003 , meteoLCD +1 Wm-2y-1 for
1998-2003.See also [9]
(derived from pyranometer data by Olivieri's method)
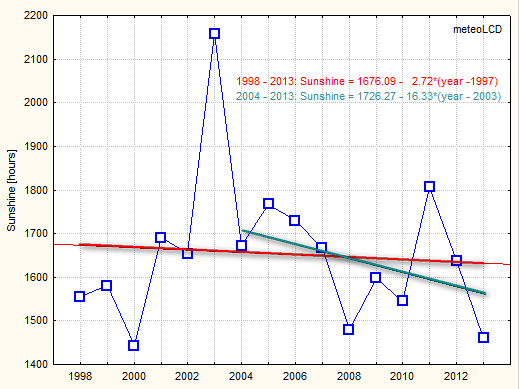
Totals for 2013:
meteoLCD: 1460.0 hours (215m asl)
Findel: 1632.7 hours
(365m asl, Campbell-
Stokes)
Trier:
1499.8 hours (279m asl)
Trend: - 2.7 hours per year
Mean +/- stdev:
1998 to 2013: 1652.9 +/- 171.3 hours
2004 to 2013: 1636.5 +/- 116.6
Note important negative trend from 2004 to 2013: -
16.3 hours per year = 163 hours/decade!
The decline from 2012 to 2013 is -10.8%, to be compared to the data from the Fraunhofer Institut which give a decline of -10.6 % of the German PV "Volllasttunden" [37]
See paper
[23] by F. Massen
comparing 4 different methods to compute sunshine duration from pyranometer
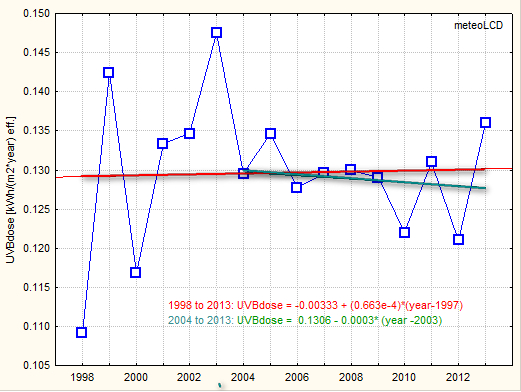
Practically flat trend line for the whole period.
mean +/- stdev:
1998 to 2013:
0.130 +/- 0.009 eff. kWh*m-2y-1
2004 to 2013: 0.129 +/- 0.005
Practically flat trend from 1998 to 2013, but
visible negative trend of - 0.3 eff. Whm-2y-1 from 2004 to 2013,
in accordance to the dimmimg measured by
the pyranometer over the same period. So dimming is confirmed by both pyranometer and UVB sensor
See
[10]
and [22] (poster finds slight
positive trend in June (+2%) and negative trend in August (-1%), no trend
for other months, for period 1991 to 2008)
The decrease in biologically effective UVB is also consistent with the
increase of the total ozone column [28]
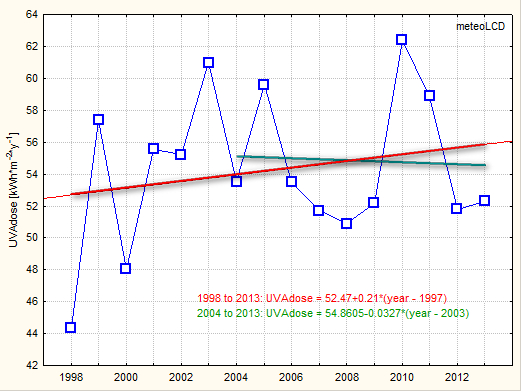
Positive trend: + 0.2 kWh*m-2*y-1, essentially caused by the suspiciously high 2010 reading. Negative trend of -30 Wh*m-2*y-1 since 2004, consistent with the pyranometer and UVB data.
mean +/- stdev:
1998 to 2013 54.3 +/- 4.8 kWh*m-2*y-1
2004 to 2013: 54.7 +/- 4.1
The exceptional high 2010 value (which
is an extrapolation due to 8% missing data) is dubious.
Omitting the 2010 data, the 2004 to 2013 negative trend is - 285 Wh*m-2*y-1
The 3 independent measures of Solar energy, UVA and UVB dose all document a solar dimming since 2004.
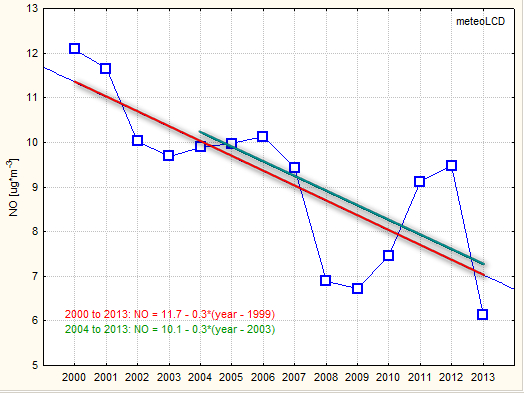
The 1998-1999 data are too unreliable to be retained.
2000 to 2013: trend: - 0.3 ug*m-3*y-1
2004 to 2013 rend: idem
mean +/- stdev:
2000 to 2013: 9.2 +/- 1.8 ug/m3
2004 to 2014: 8.5 +/- 1.5
Many missing data from 2011 to 2013 ( 25%, 21% , 8%) so be careful! All
these concentrations are very low! Luxembourg-City has a background of 25-30
and rural Vianden (Niklausberg) one of 2.5 (approx. 2013 values from
[39])
see [11] which gives ~30% reduction from 1990 to 2005 for the EU-15 countries.
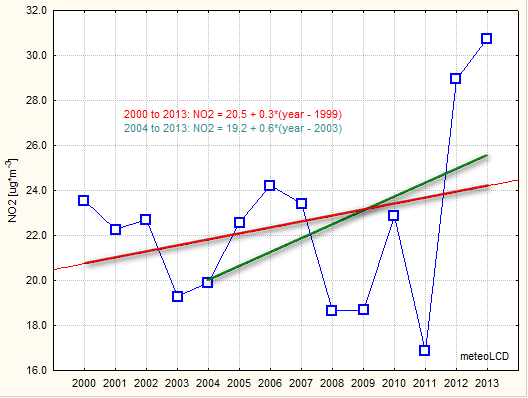
The 1998-1999 data are too unreliable to be retained.
2000 to 2013: trend: + 0.3 ug*m-3*y-1
2004 to 2013 rend: + 0.6
mean +/- stdev:
2000 to 2013: 22.5 +/- 3.9 ug/m3
2004 to 2014: 22.7 +/- 4.5
Many missing data from 2011 to 2013 ( 25%, 21% , 8%) so be careful! All these concentrations are low! Luxembourg-City has a background of 58 and rural Vianden (Niklausberg) one of 9.4 (average since 1988) [38]
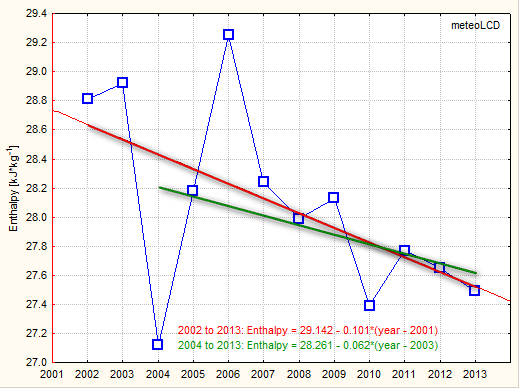
See [24] on how the energy content of moist air is
calculated. Several authors, as Prof. Roger Pielke Sr. insist that air
temperature is a poor metric for global warming/cooling, and that the energy
content of the moist air and/or the Ocean Heat Content (OHC) are better.
Mean yearly moist enthalpy values are very close, but they may change from
zero up to 60 Kj/kg during a year. Moist enthalpy can not be
calculated for temperatures <= 0 °C.
mean +/- stdev:
2002 to 2013
28.1 +/- 0.7 kJ/kg
2004 to 2013: 27.9 +/- 0.6
Trend is clearly negative: -0.1 KJ/kg per year (or 0.06 for last
decade) which is consistent with
the trends in temperature, solar energy, UVA and UVB doses.
