20
Jul
24 |
Again a tiny thunderstorm, which managed only to go North up to the
midst of Luxembourg; click on the picture for an animation:
 |
16
Jul
24 |
There was a problem with the half-hour downloads of the data from
datalogger to computer. Real cause remains unknown. All ok again
(17:00 UTC), there are some glitches in the graphs to ignore... |
15
Jul
24 |
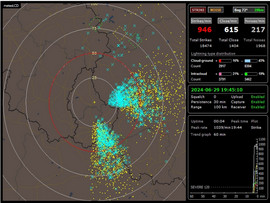
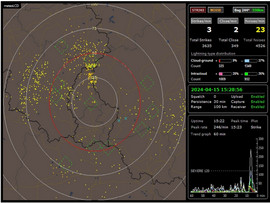
We had a very "normal" thunderstorm, despite an awe inspiring
warning issued hours before by the authorities; click on the picture
for an animation.

What's interesting is that the storm moved very quickly: compare
the position of the most recent strikes (blue crosses) between picture 2
and 3: it is about 18km for an interval of 6 minutes, which gives
about a maximum speed of 180 km/h ! (could be a bit less, ca. 154
km/h, if one uses the time-stamp of the screen-capture). |
01
Jul
24 |
Upload jun24.dat
into data archive |
29
Jun
24 |
1.
I noticed this morning that the current sky image from our webcam
has not been updated (for a long time): actually the camera was dead
. Problem was, as so often, a bad contact. All ok again since 12:00
UTC. 2. We had a rather nice storm in the evening. Look here at
the animated gif; the first two pictures show the screens of EUCLID
and BLITZORTUNG. The next are those of our Boltek, spaced at 2
minutes interval:
There was a problem at the beginning, with the computer showing
nothing. A reboot solved this. |
14
Jun
24 |
The CAIRSENS O3&NO2 sensor has been refitted with a new filter at
12:30 UTC. A new filter will take some time to reach constant
operation. |
07
Jul
24 |
The problem with the graph of the TOC has been solved. The cause of
the malfunction was so silly that I can not mention it.... |
05
Jun
24 |
There is a problem with the graph of the TOC values (Dobson values).
As another possibility, click on the
link to the Excel file to see two graphs related to meteoLCD
and Uccle TOC values. |
01
Jun
24 |
Upload may24.dat
into data archive |
02
May
24 |
1.
Upload apr24.dat into data archive
2. First thunderstorm for this month ( time = UTC = local time -2):
 |
01
May
24 |
Restarted WBGT sensor assembly at 12:00. Watch how the web
bulb temperature starts to become lower than the dry bulb
temperature... |
15
Apr
24 |
Today we had our first real thunderstorm, short-lived. Click
on the picture for a full animated GIF showing the progression from
South to North. The blue crosses are the latest strikes, the yellow
dots the older ones. The hashed squares are the location where the
software thinks the storm is mostly located. Watch how these domains
progress to the North. Time is UTC ( = local time - 2).
|
01
Apr
24 |
Upload mar24.dat
into data archive |
03
Mar
24 |
Upload feb24.dat
into data archive |
01
Mar
24 |
Our vintage Delta-T logger does not know about leap years... so it
took the 29th Feb as first March. The monthly data file will be
corrected, but the plots (today, last 7 days) will be a bit
strange... best ignore this,as everything is self-healing. |
08
Feb
24 |
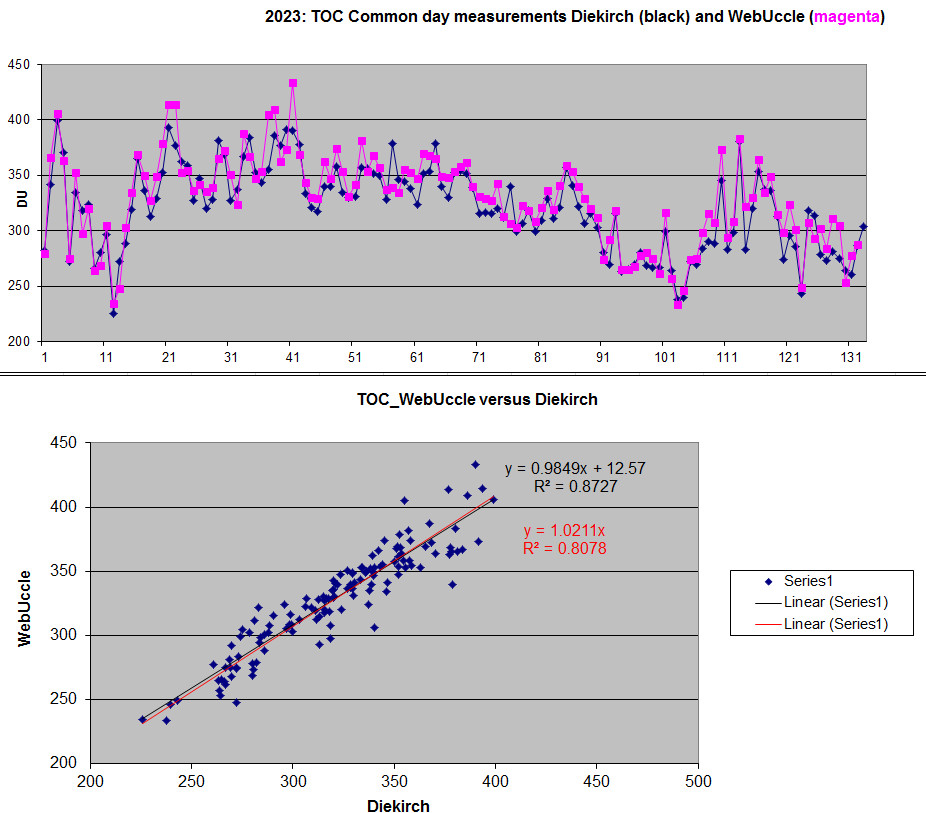
Trends analysis for 2023 now finished. For the comparison of
the meteoLCD TOC readings with those of Uccle, only the month's Jan
to Nov are used, as the Uccle data are not yet available on the
WOUDC site. The comparison with the "WebUccle" readings covers the
full year. |
07
Feb
24 |
There was a remaining contact problem with the pressure sensor,
corrected this morning at 08:00 UTC. I also removed the pressure
correction applied to the Gnuplot CO2 graphs, as the pressure fault
made these plots absolutely wrong... |
06
Feb
24 |
The CO2 problem is solved (13:0 UTC); there was a bad contact on the
cable connector to the Vaisala GMP343 sensor. The 7 days plot will
be bad for a week due to the the autoscaling feature of Gnuplot. |
05
Feb
24 |
There is a problem with our CO2 measurements starting the 30th
January, Will try to solve asap... |
02
Feb
24 |
Upload jan24.dat
into data archive.
Trends page update to 2023 trends nearly finished; PM2.5 fine
particle data and TOC (total ozone column) in work. |
14
Jan
23 |
I started to update the
trends page..
this is ongoing work. |
10
Jan
24 |
Uploaded into data archive
2023_only.xlsx Excel file with all readings, dailys and
monthlys and monthly Findel values. Also
meteoLCDstats_1998_2023.xlsx statistics file.
|
01
Jan
24 |
1. Our old faithful Delta_T datalogger does not store the
year count in its data-time column, so there usually is a mess with
the Gnuplot 7-days plots during the first week (but not with
the "today" plots).
2. Upload dec23.dat
and full year 2023.zip
data into data archive
3. Look
here for a comparison between our total ozone column
(TOC) measurements with those published by the RMI at UCCLE on their
web-site (only common days retained). Theirs is probably a mix of direct sky (DS) and zenith-sky
(ZS) measurements, whereas we only measure DS. As usual ours are not
too bad, no reason to be ashamed of ! And please remember that
meteoLCD is since more than 20 years the only station in Luxembourg
measuring TOC (and recognized by the
WOUDC as station 412). I want especially give thanks to Mike
Zimmer for helping out with these measurements.
|

