04
Dec
20 |
The rain-sensor was again blocked by bird-poo, probably since 1st
december. Nothing of the precipitation quantity of the past days is
lost, and corresponds to the "fake" peak of today. |
01
Dec
20 |
Uploaded November 2020 data (nov20.dat)
into data archive. |
19
Nov
20 |
TOC is back to 297 DU. These 2 days (18&19/11) are a nice
example how variable the total ozone column can be; ground ozone
concentrations were close, solar zenith angle also, but the AOT
(Atmospheric Optical Thickness) was higher today (about 0.18 versus
0.30 cm), what is not sufficient to explain the huge difference in
DU. |
18
Nov
20 |
Spectacular plunge of TOC (Total Ozone Column) today to 208.5 DU;
this dive is also seen at the RMI (Uccle, Belgium). Look
here. |
01
Nov
20 |
Uploaded October 2020 data (oct20.dat)
into data archive. |
26
Oct
20 |
Special filter of Cairsens O3&NO2 sensor replaced. Readings may be
take some time to come back to "normal" . |
12
Oct
20 |
The temperature signal of the UVB sensor was bad starting the 4th
Octobre at 18:00 UTC, probably caused by a bad contact. The
temperature regulation itself was probably ok as the UVB readings
are correct, so that the impossible negative UVB_Tin readings will
be manually adjusted to 25°C in the monthly data file. "Repaired"
today at 06:55 UTC. |
01
Oct
20 |
Uploaded September 2020 data (sep20.dat)
into data archive. |
29
Sep
20 |
1. Stopped WBGT (heatstress-sensor) up to next May.
2. The rain sensor was blocked by dirt during the last week. Please
check rainfall of past weeks on the backup station. This has been
repaired now. Ignore the rain spike of this morning; I tried to
recup most of the stagnant water so to keep the total precipitation
acceptable. |
01
Sep
20 |
Uploaded August 2020 data (aug20.dat)
into data archive. |
03
Aug
20 |
Updated Total Ozone Column (Dobson) measurements. During vacation
times the measurements continue to be done regularly by Mike Zimmer,
if possible. Updates on the website will be made only every 2nd or
3rd week. |
01
Aug
20 |
Uploaded July 2020 data (jul20.dat)
into data archive. |
22
Jul
20 |
Important news:
1.The Linux computer stopped transmitting data to the website
server on Saturday 18th July, for reasons unknown. A second
problem is that the usual SSH software sees its login procedure
refused. As I am working from abroad, I was able to restart the
Linux machine, and regain access using the latest 64bit PuTTY
version. Let's hope that this is an exceptional glitch, and not a
sign of worsening computer health!2.A second minor problem was an
not-updated link to Blitzortung at the lightning page. The
correct URL ist
www.blitzorung.org (and not blitzortung.de as previously). |
01
Jul
20 |
1.
Uploaded June 2020 data (jun20.dat)
into data archive.
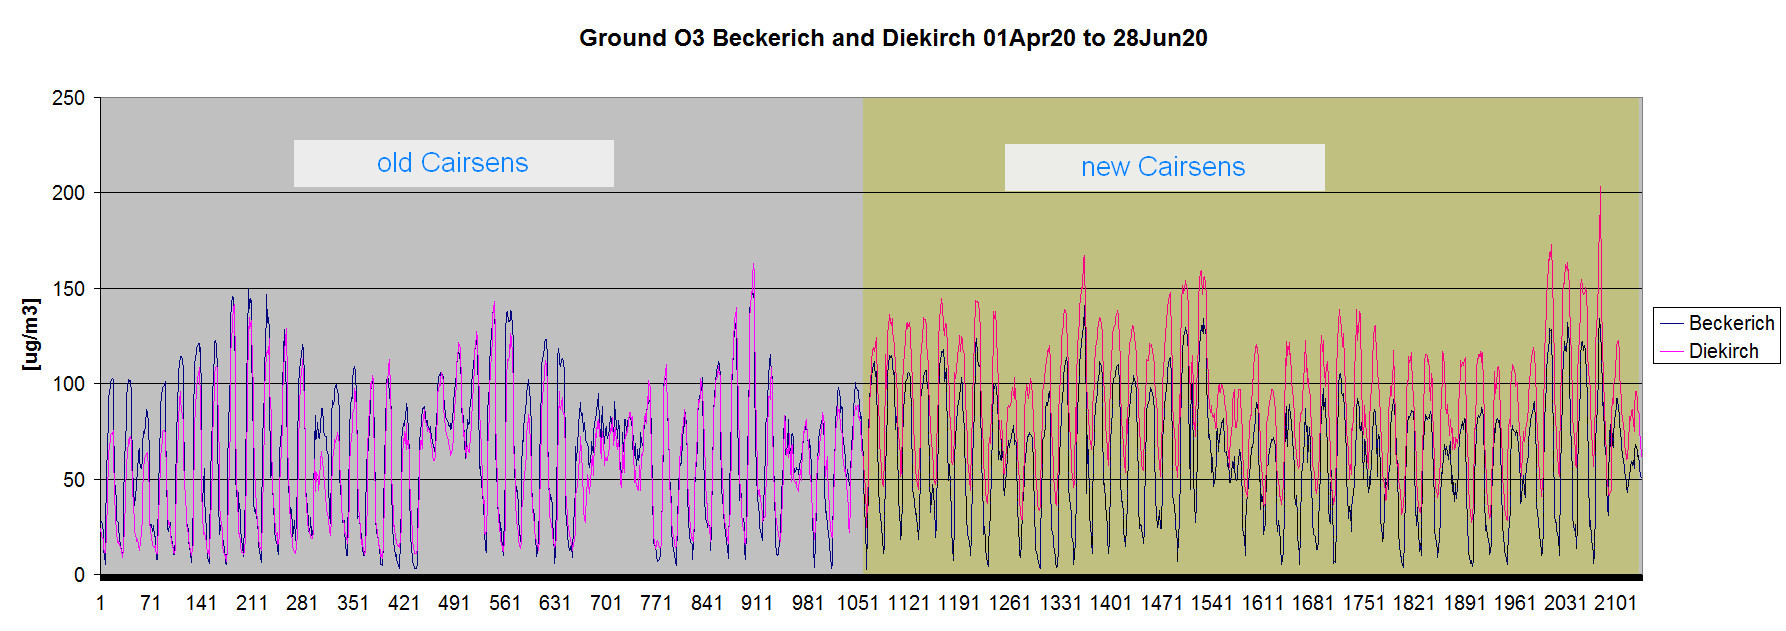
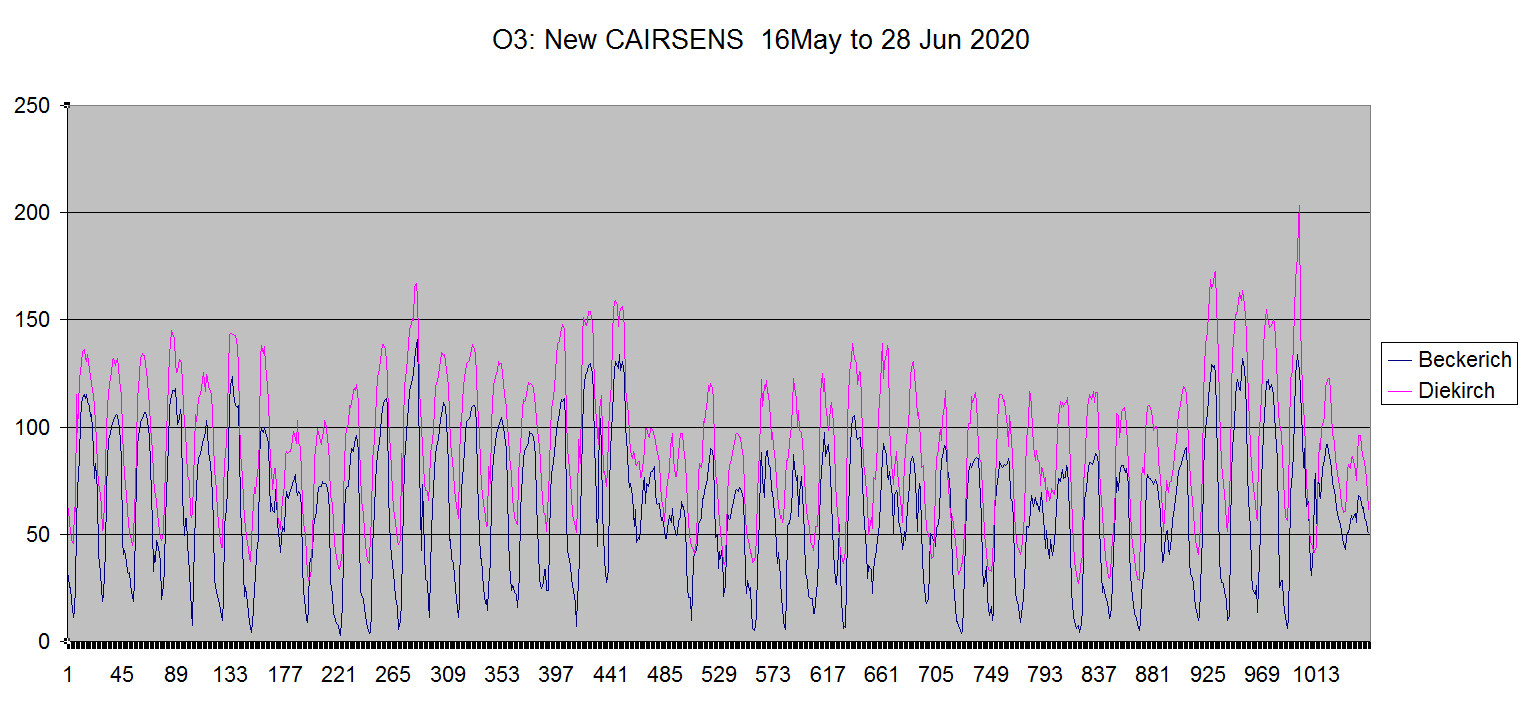
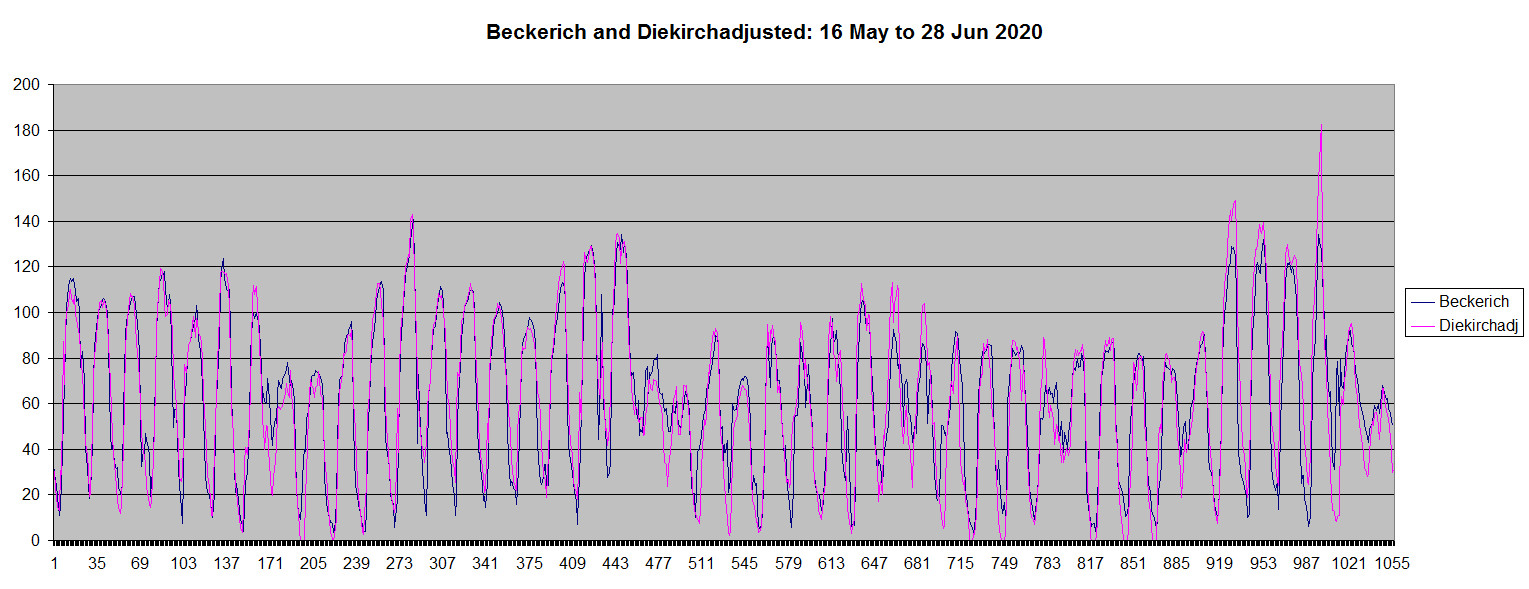
2. Programmed a new adjustment function for the new Cairsens
O3&NO2 (AQ) sensor: it's O3 readings are much too high. The O3
readings of the official Beckerich station are very close to our
correct O3 readings, as given by the previous CAIRSENS. The
adjustement function to apply is
Diekirchadj = Diekirchraw/0.9311 - 36.309
This function has been programmed into the datalogger starting
01Jul20 09:00 UTC.Here as an illustration the raw and
adjusted readings of Beckerich and Diekirch:
1. Beckerich and Diekirch 01 Apr to 28 Jun (old and new
sensor):
2. Beckerich and Diekirch 16 May to 28 Jun (new sensor):
3. Beckerich and Diekirch adjusted 16 May to 28 Jun (new
sensor):
|
21
Jun
20 |
The wet bulb thermometer of the WGT system ran dry, because the
timer commanding the demineralized water pump stopped working...I
made a total reset this morning, reprogrammed, and it seems ok... |
12
Jun
20 |

Click for animation of strong thunderstorm going over Luxembourg.
Time in pictures is UTC (= local time - 2h). |
01
Jun
20 |
Uploaded may 2020 data (may20.dat)
into data archive. |
26
May
20 |
The WBGT heatstress equipment has been relaunched for this year.
There was a bad surprise with the Globe temperature, that was
much too high. I suspected a PT100 fault, but actually the culprit
was a Phoenix Contact MCR PT100 amplifier which had gone bad. By
sheer luck, I had a spare ! |
15
May
20 |
Removed old CAIRSENS O3&NO2 sensor which was installed
03-Apr-20. Replaced by new model. According to the
calibration document this new one could have a zero bias of about
+7.5 ug/m3 (i.e. its readings are too high). I will wait a couple of
weeks, as the filter and sensor take some time to reach stable
operation, and than decide to implement or not a calibration
correction in the data logger. |
02
May
20 |
I finished a 3 part comment on the influence of wind speed on CO2
and O3 concentrations. You may read it on the blog
here. |
01
May
20 |
Uploaded april 2020 data (apr20.dat)
into data archive. |
08
Apr
20 |
I wrote a short comment on the experience of reviving an vintage
Haenni Solar sunshine duration sensor. We have now 54 days of
operation and can compare this retro instrument with our (and other
stations) data. The result is surpising! Click here:
Reviving
a vintage Haenni Solar sunshine duration sensor at meteoLCD,
Diekirch, Luxembourg. |
04
Apr
20 |
1.
The TRENDS
section has been updated to include our fine particle
measurements for the full year 2019 (measurements by an
Airvisual Pro sensor).
2. Today we had a rather visible slump in the TOC (total
ozone column), a good occasion to compute the RAF (radiation
amplification factor), which expresses the increase of UVB caused by
a decrease in ozone: here you should compare the situation at the
30th March and the 4th April.

This slump certainly is a borderline effect of an ongoing unusual
ozone thinning above the Arctic. Read
here
and look picture
here. You might (re-) read my 2013 paper on this
here. |
01
Apr
20 |
Despite the Covid-19 quarantine, meteoLCD continues its work. The
data from March 2020 (mar20.dat)have
been uploaded into the data archive. |
19
Mar
20 |
The Lubuntu computer which is busy with many stuff (plots, transfers
....) stopped working at 04:30 today, reason unknown. A reboot cured
the problem (what "The IT crowd" series on Netflix typically suggest
as a cure for all computing problems). |
18
Mar
20 |
I started adding some graphs on the COVID-19 situation in Italy and
Luxembourg. These will stay on top of other comments. See more on
the blog! |
16
Mar
20 |
A new paper by
F.Massen, M.Zimmer, R. Tholl and C. Baumann on the annual cycle
of the total ozone column, and a comparison with the situation
at Uccle (Belgium). Our sinus-pattern (using all measurements from
2000 to 2018) is very close to that found in the Uccle data.
Again a confirmation of the seriousness and quality of the meteoLCD
measurements! |
09
Mar
20 |
The update of the "Trends"
section to include 2019 data is finished. Look at the addendum 3
for how close our CO2 airspeed model coincides with Mauna Loa CO2
average for 2019. |
03
Mar
20 |
The problem with corrupt plots has been solved. At the origin was
the leap year problem, together with some parameter settings which
became wrong by a date going from 28/02 to 01/03. Everything runs
now ok (11:30 UTC); the 7 days plots will take some time to populate
again... So no hardware malfunction, just silly software! |
02
Mar
20 |
1. Upload of feb20.dat file into the
data archive.
2. There is a serious computer problem (starting the 01March at
midnight) with the whole procedure going from the transfer of the
data from the datalogger, the making of the plots and the transfer
to our web-site. I was able to manually relaunch this morning, after
the system went bad again after a few hours. Our logger does not
handle leap years, so this could be one cause, another being a
hardware problem. |
22
Jan
20 |
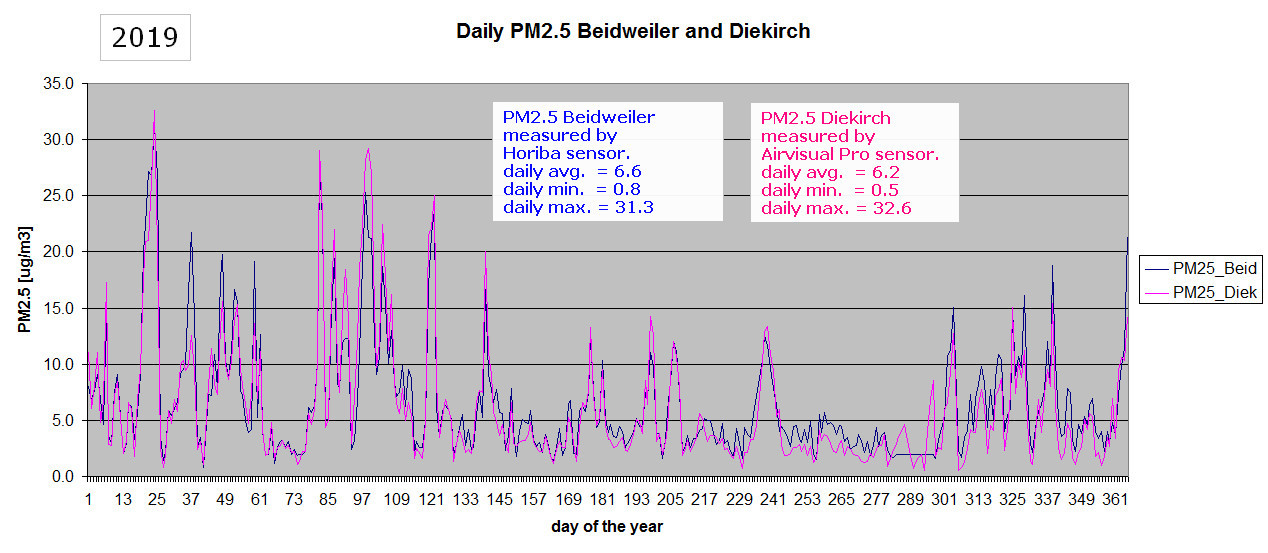
I have updated the last graph by correcting some date problems (the
Beidweiler data are from an EEA file, and the values are not always
in chronological order, there are also many missing values...). The
following figure of the daily averages shows that our PM2.5
data are really excellent (look at the peaks, the min. and max.).
The PM10 Airvisual data (not shown here) are too low (too similar to
the PM2.5 readings).

More on the
BLOG ! (added 23-Jan-20) |
21
Jan
20 |
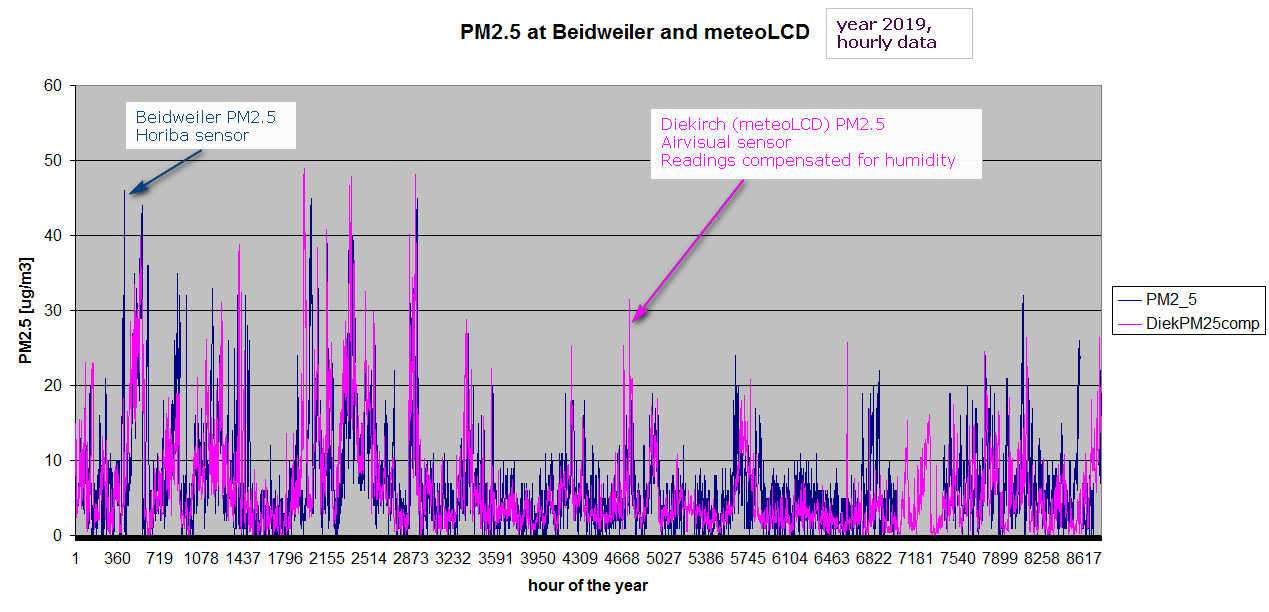
Our Airvisual fine particle sensor (PM2.5 and PM10) worked for a
full year without major problems. Click on the picture below to see
how good our PM2.5 measurements follow those of the Beidweiler
station (which we usually use as a reference). Beiweiler has a
hugely expensive Horiba sensor, compared to our Airvisual Pro (by
iQAIR).
 |
15
Jan
20 |

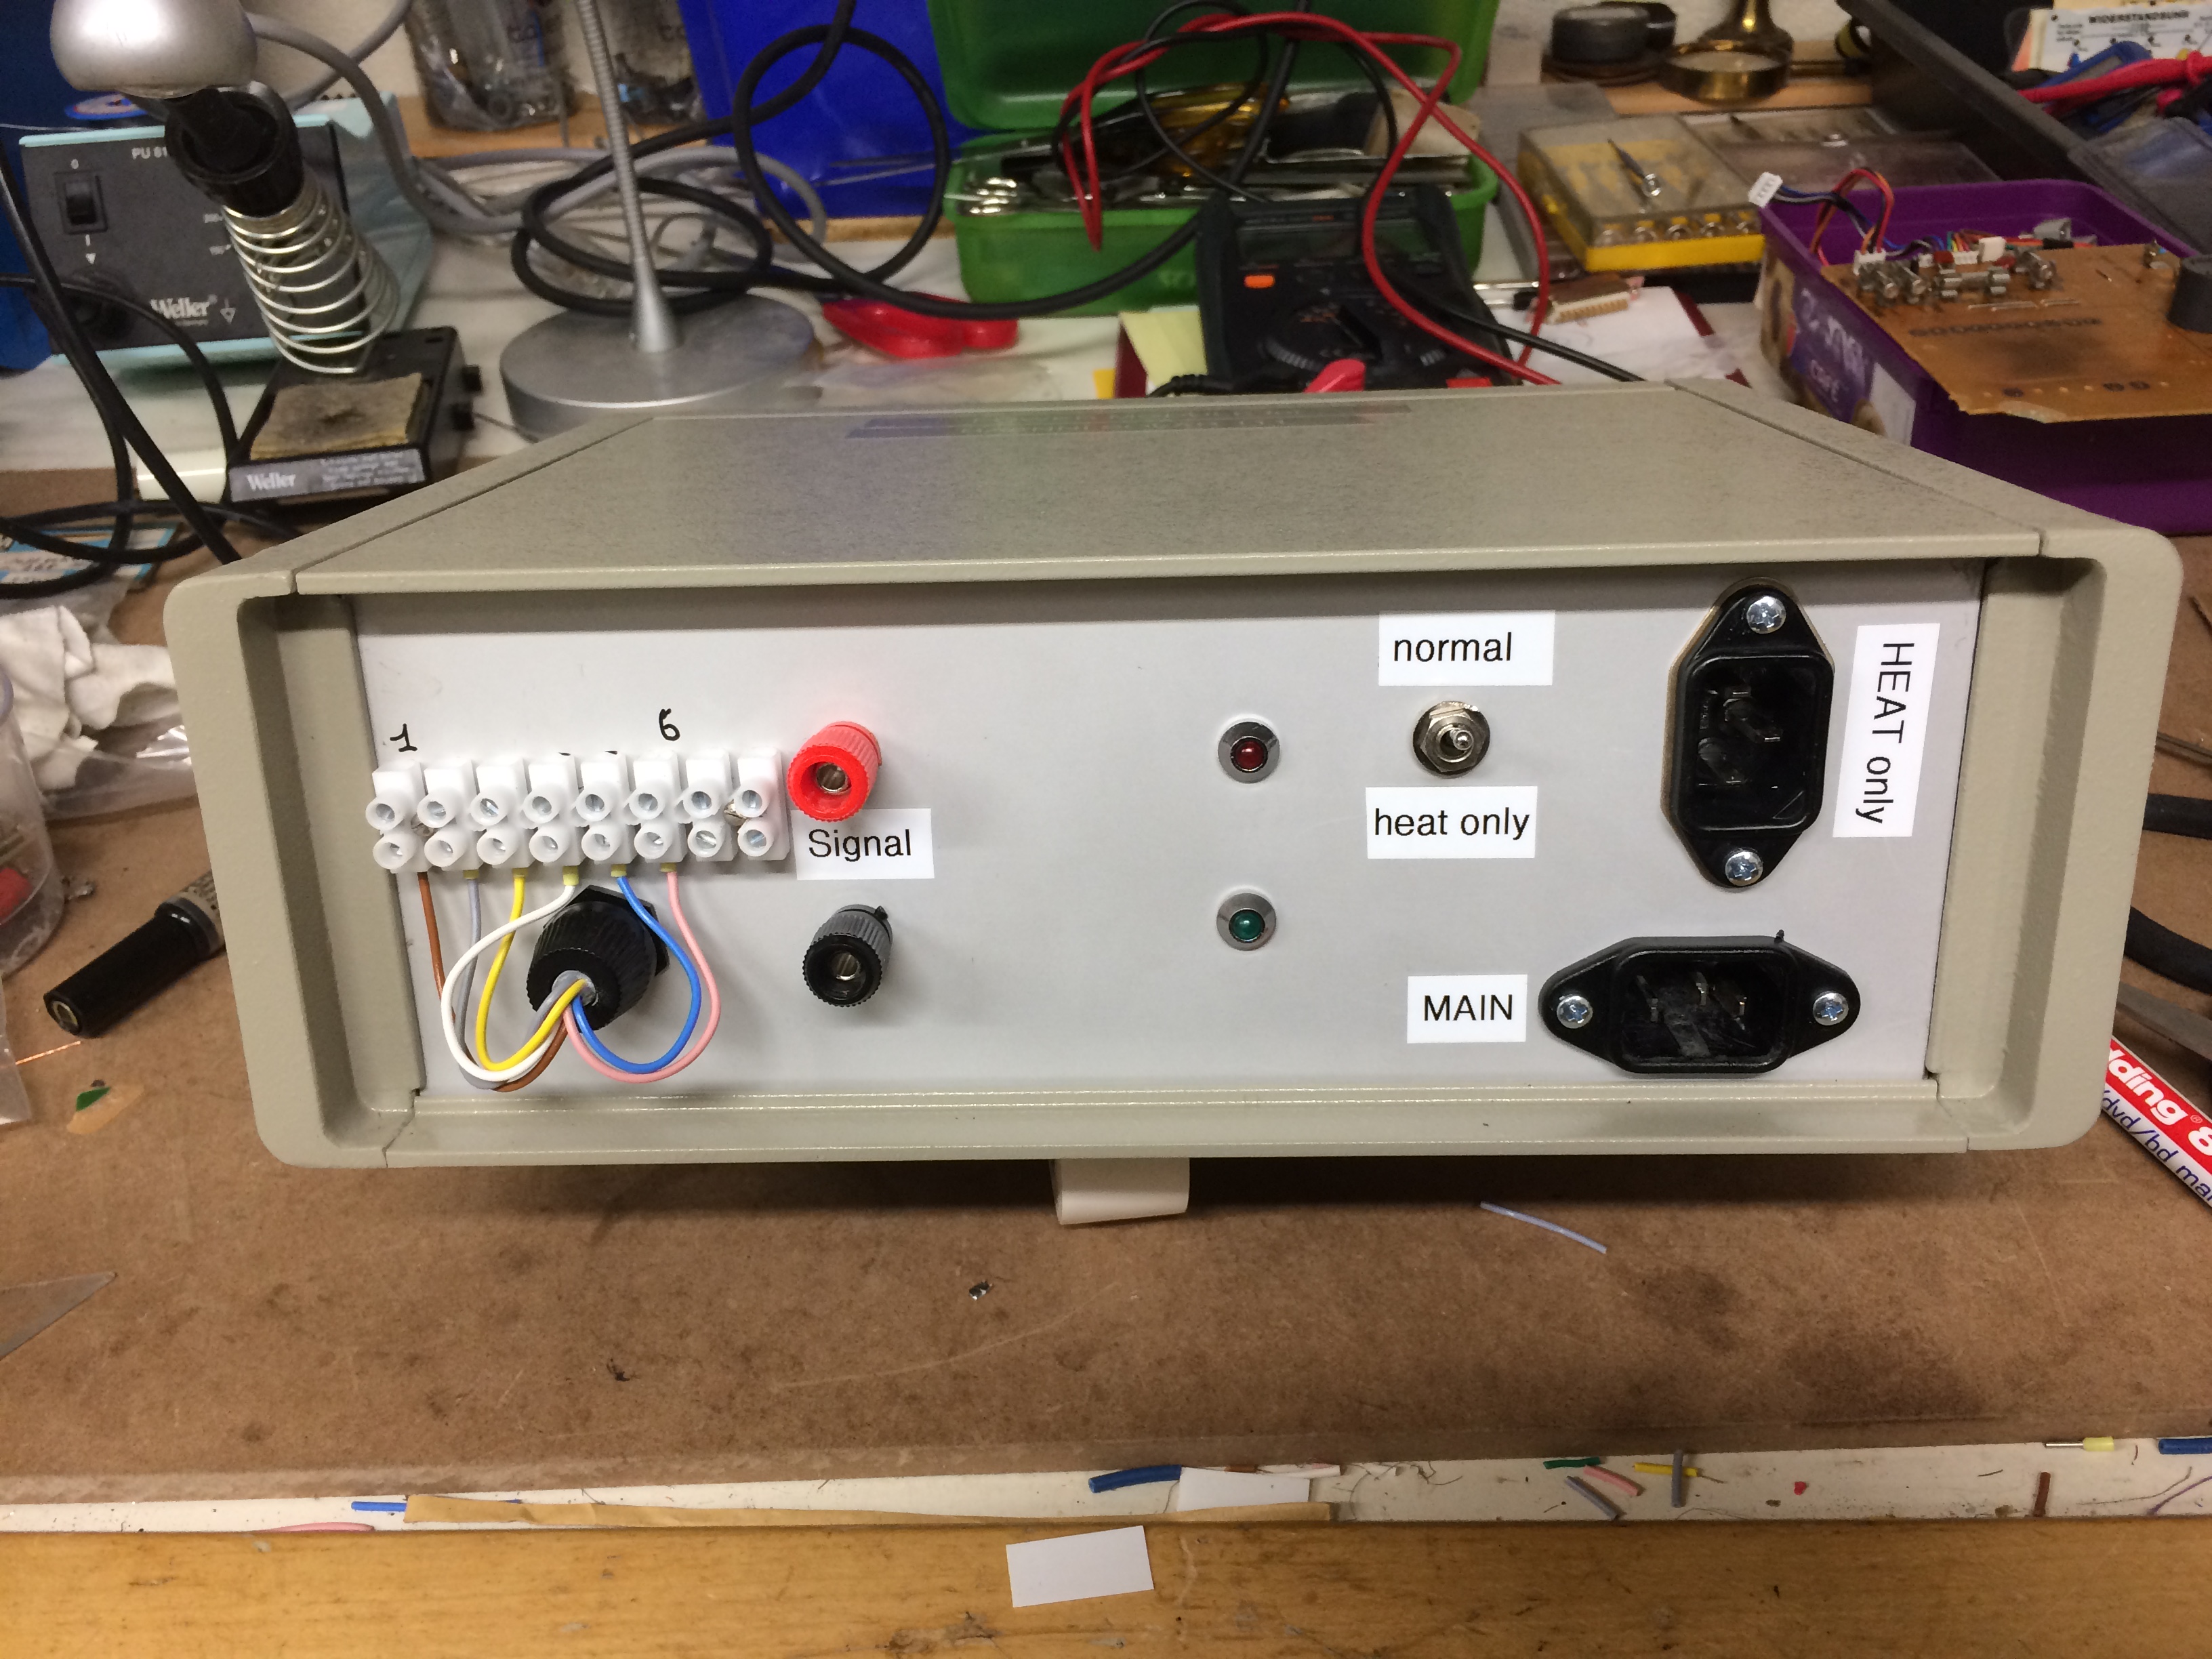
I built a power-supply for the vintage Haenni Solar111 sunshine
duration sensor (see last year
news), which is spinning relentlessly on our terrace. A first
readout of the logger data shows no problems. The sensor is now
configured to run continuously 24/24, and its output is stored
simultaneously on two dataloggers: a vintage refurbished Mikromec
logger from the 90's, and a more recent one from Onset. The output
signal is either -3.77V when the sun does not shine, or +4.17V when
it shines. The power-supply allows several modes of operation (e.g.
motor/electronics shut-off during the night, but heating reaming
on). Readings are done every minute. |
13
Jan
20 |
There was a serious problem: the logger was not logging since the
last data download (my fault :-(( ). It will restart today at 18:00
UTC. |
12
Jan
20 |
The Excel file "2019_only.xls" has been created and is
available at the data archive
folder. This file holds all 2019 measurements, with daily and
monthly's subset and readings from the Meteolux Findel station. |
01
Jan
20 |
1. The usual dogs-dinner in the 7days plot due to Gnuplot problems
with handling previous and new year (the logger files do not contain
the year number). This will be self healing in the next 7 days.
2. Upload dec19.dat into
data archive.
|