meteoLCD and
Physics Lab of t he LCD
32 avenue de Gare
L-9233 Diekirch

click icon for pdf version
Pattern of CO2 and other atmospheric gases during a cold weather inversion
|
meteoLCD and
Physics Lab of t he LCD
|
click icon for pdf version |
Abstract:
From the 9th to 12th January 2009 Diekirch (Luxembourg) was under a regime of constant negative temperatures, low wind speed and a practically stable high atmospheric pressure. This created an inversion situation with an unusual CO2 pattern, where the mixing ratio is rising in a nearly constant manner. The 4 days stable boundary layer also gives a nice example of ongoing NO titration of ground ozone.
1. The meteorological situation from 9 to 12 January 2008
Luxembourg was (similar to a sizeable part of Europe) under the influence of a very cold spell from the 9th to the 12th January 2009. Temperatures never exceeded 0°C, wind speed was very low, and the atmospheric pressure was at a constant high of nearly 1004 hPa (i.e. 1032 hPa barometric pressure):
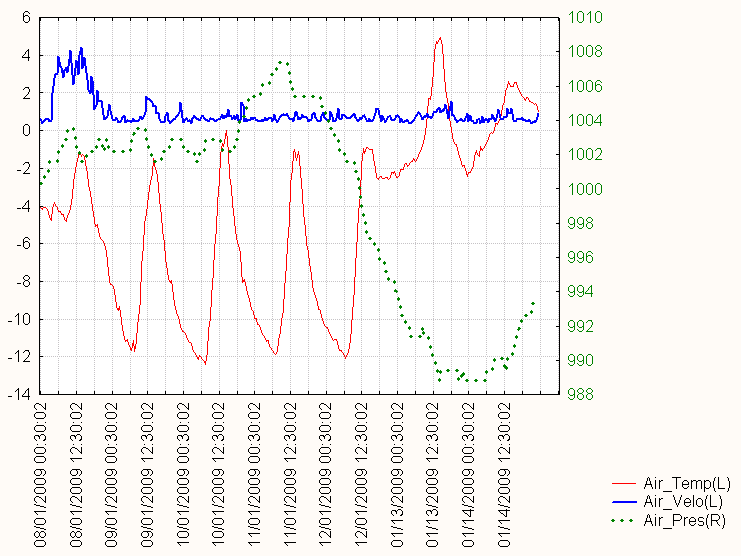
Fig. 1: Temperature, wind-speed and atmospheric pressure
The result of these conditions was the formation of a stable ground-based inversion layer for 4 days; neither horizontal nor strong vertical air movements did mix up the boundary layer and all gases emitted from heating, traffic and possible natural sources remained more or less trapped in that layer.
2. CO2 patterns
The "normal" diurnal CO2 mixing ratio at Diekirch shows a pattern with a typical peak during the night (often even a double peak [1]), a late afternoon maximum and one distinct low after 12:00 at the time of the highest air temperature.:
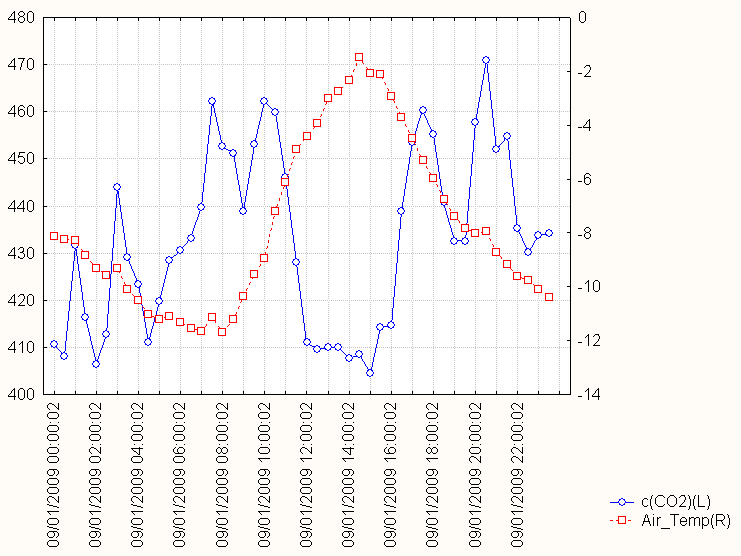
Fig.2: Typical daily CO2 pattern with nocturnal, morning and late evening highs and a minimum at noon.
The higher temperature at noon causes the greatest convective mixing of the
day, and thus by dilution the lowest CO2 mixing ratios of the day. The minima
are commonly seen as the CO2 base-level of the atmosphere at in-land
locations. During normal working days, the morning peak caused by increased
traffic from commuters corresponds to an increase of about 30 ppmV relative to the
preceding minimum at nighttime. This increase is noticeably lower during the
Sunday with no commuting traffic, as shown in table 1.
| day of the week | change of
morning 07:00 CO2 relative to precedent night minimum |
comment |
| Friday 09Jan09 | +33 ppmV | very low wind velocity, constant high pressure |
| Saturday 10Jan09 | +24 ppmV | very low wind velocity, constant high pressure |
| Sunday 11Jan09 | +6 ppmV | very low wind velocity, constant high pressure |
| Monday 12Jan09 | +35 ppmV | very low wind velocity, drop in air pressure |
Table 1.
Thus it could be assumed that under stable inversion conditions, morning traffic adds at most 29 ppmV to the overall CO2 mixing ratio. This assumes that no other big CO2 sources absent on Sunday (as stepped up heating during working days) spring into action during the working days morning hours, what may be a reasonable assumption.
The 4 days long inversion layer essentially blocks or hinders the mixing of the boundary layer: The observed pattern is one of steadily increasing CO2 mixing ratios; both maxima and minima rise in a near linear manner with a similar gradient of approx. 0.6 ppmV/half-hour i.e. 29 ppmV/day.
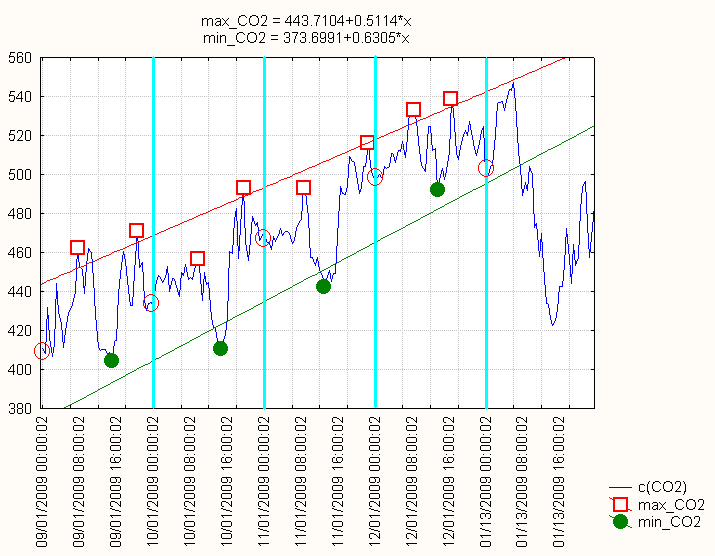
Fig. 3: Near linear rise of minima and maxima daily CO2; notice the difference between the daily "entry" points marked by red hollow circles.
Atmospheric pressures are starting to decline from 1006 to 994 hPa during the
12th January; but horizontal wind velocities measured by the anemometers (both
ultrasonic and cup anemometer) remain low. The CO2 values stop rising
the12th
January; this is also the first
day where the mixing ratio at the end of the day is lower than that of the start
of the day (see hollow red circles in fig.3). So the pressure drop must have caused some atmospheric vertical air
movements which can not be detected by the anemometers, but whose result is a
return of mixing up of the boundary layer and an end of the inversion period.
The following day of 13th January air temperature becomes positive again,
air
velocities increase and CO2
values nose-dive from about 550 ppmV at midnight to 420 ppmV at noon.
Table 2 resumes the daily pattern of CO2, temperature, pressure and wind velocity (mean +/- standard deviation)
| day | CO2 [ppmV] | temperature [°C] | pressure [hPa] | wind speed [m/s] |
| Friday 09Jan09 |
432.7 +/- 18.9 | -7.7 +/- 3.1 | 1002.5 +/- 0.6 | 0.8 +/- 0.4 |
| Saturday 10Jan09 |
449.2 +/- 19.3 | -7.8 +/- 3.9 | 100.2.9 +/- 1.0 | 0.7 +/- 0.2 |
| Sunday 11Jan09 |
475.5 +/- 20.3 | -7.9 +/- 3.5 | 1006.0 +/- 0.8 | 0.7 +/- 0.2 |
| Monday 12Jan09 |
513.1 +/- 11.3 | -6.2 +/- 4.5 | 999.4 +/- 3.3 | 0.7 +/- 0.2 |
| Thursday 13Jan09 |
483.9 +/- 36.6 | 0.0 +/- 2.3 | 990.7 +/- 1.5 | 0.8 +/- 0.3 |
Table 2
The gradient for the daily mean [CO2] over the 4 days from 09 to 12 January is +26.9 ppmV/day (slope of the linear regression), similar to that of the daily maxima or minima values given above.
3. NOx patterns
NO and NO2 concentrations show a similar pattern as CO2 mixing ratios:
during the 4 days of inversion the
overall concentrations are steadily rising with the following gradients:
| gradient of daily mean NO | +11.1 ugm-3 |
| gradient of daily mean NO2 | +5.1 ugm-3 |
CO2 peaks are in sync most of the time with those of NO and NO2. The influence of lower morning traffic at Sunday 11th clearly shows up in a very diminished NO peak. The constant rise stops during the 12th January, and NOx concentrations plunge as does the CO2 mixing ratio.
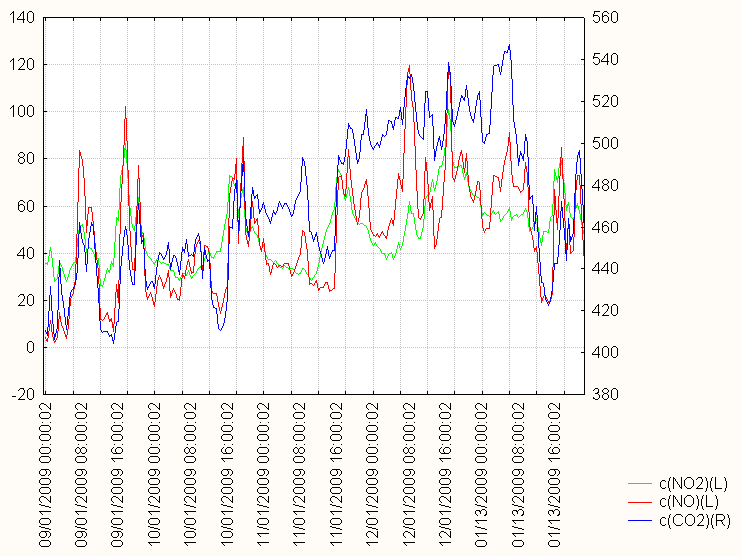
Fig.4: NO, NO2 and CO2 pattern. NO and NO2 concentrations in ugm-3 (right axis) and CO2 mixing ratio in ppmV (left axis)
4. Ground ozone
NO is an ozone destructor, so it does not come as a surprise that the rising daily NO minima cause lower and lower corresponding O3 maxima, as shown by fig.5.
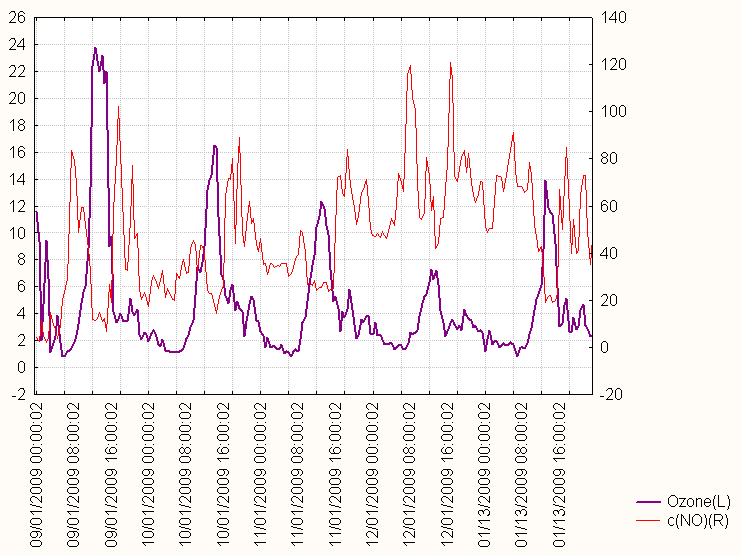
Fig.5: NO (ugm-3, right axis) and ground ozone (ugm-3, left axis)
The maximum solar (and UVB) irradiance was nearly constant (fig. 6)
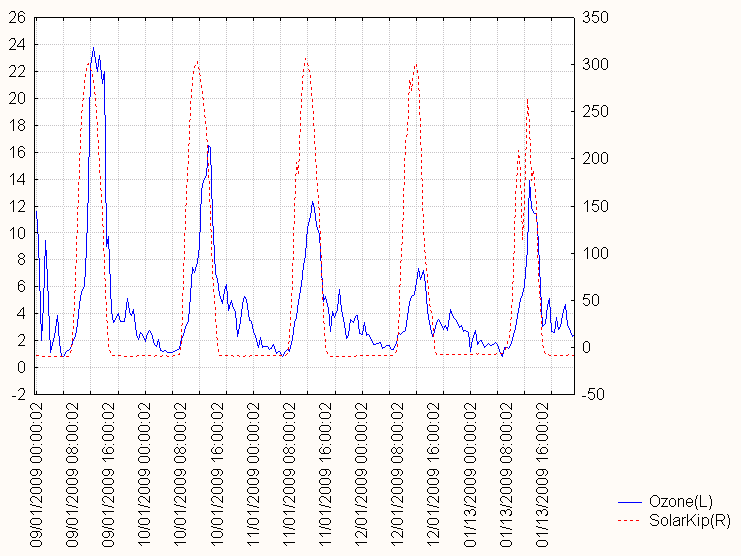
Fig. 6: Solar irradiance and ground ozone
Clearly the relevant factor in lowering O3 maxima was increased NO titration by the higher NO minima.
Very broadly speaking, O3 concentrations should be proportional to [NO2] and inverse proportional to [NO], i.e.
[O3] = k* [NO2]/[NO]
where k is a constant (varying with VOC concentration and other meteorological factors).
A report written in 1998 [2] found an approximate value k = 13 for summer air temperatures between 29°C and 31°C
A best fit estimation to the daily average data from the 9th to the 12th January gives k = 4.6 +/- 0.4 (R2 = 0.86); applying the model to the daily maximum O3 and the nearly synchronous NO2/NO readings gives k = 7.1 +/- 1.2 (R2 = 0.64). In the January situation studied here, it should be noted that both the concentration of VOC's (which are mostly of natural origin, e.g. terpenes and isoprenes) and temperature are lower, explaining the lower value of the constant k compared to that found in the 1998 report.
The 13th January the relative high NO minimum of the previous days are past history, and as consequence of reduced NO titration O3 peaks rise back to higher values.
5. Conclusion
The 4 days stable inversion period represents a rare and unique situation for the Diekirch location; it enables the study of different atmospheric processes in a near laboratory manner.
CO2 values rise linearly, showing nevertheless the influence of the morning rush hour traffic. NOx concentrations do the same, with telltale lower NO peaks during the lower traffic day of Sunday. Ground ozone levels fall in a perfect linear manner, as higher NO minima cause stronger O3 destruction.
With the end of the cold spell during the 13th January and air temperatures rising markedly above 0°C, the usual daily patterns for all gases resume.
References:
[1] Massen F, Kies A, Harpes N.: Seasonal and diurnal CO2 patterns at Diekirch, Luxembourg, 2003-2005. http://meteo.lcd.lu/papers/co2_patterns/co2_patterns.html
[2] Massen F. et al: A short report on ozone, NO and NO2 concentrations. http://meteo.lcd.lu/papers/ozone/shortO3/short_o3.html
History:
version 1.0 original version, 31 Jan 2009