latitude = 49°52' North
longitude = 6°10'
altitude = 218 m a.s.l.
| Look here: | 1.
Intercomparison
between the ozone measurements of the Microtops II and those made
by the Brewer instruments at the RMI at Uccle: 2017,
2016,
2012,
2011, previous
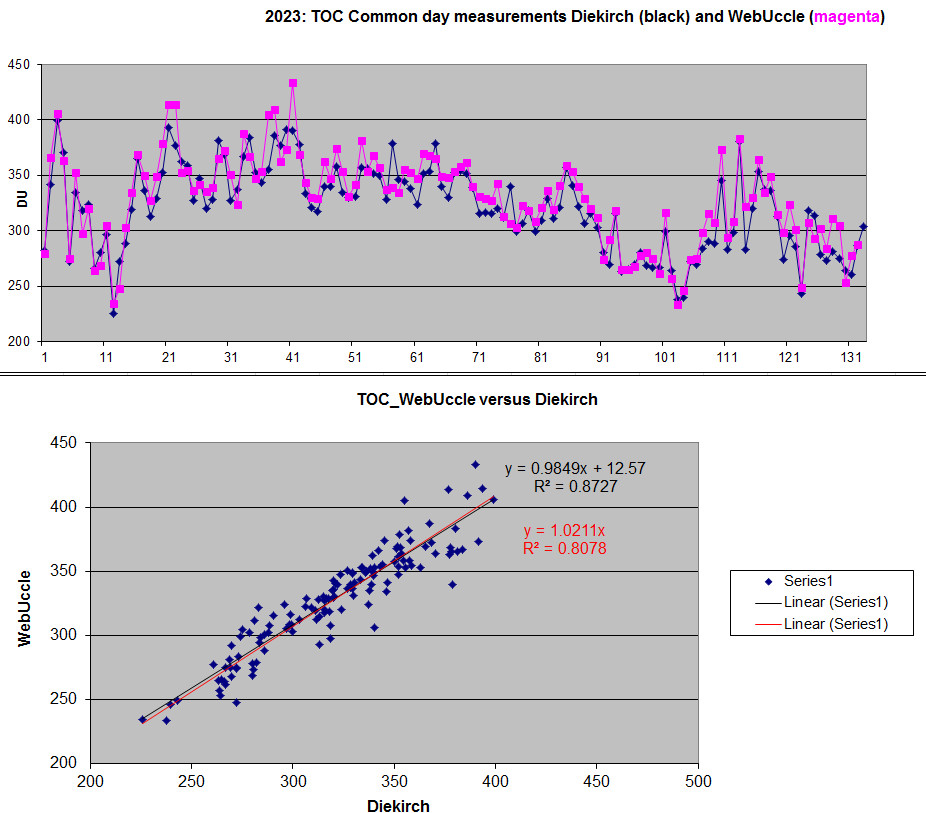
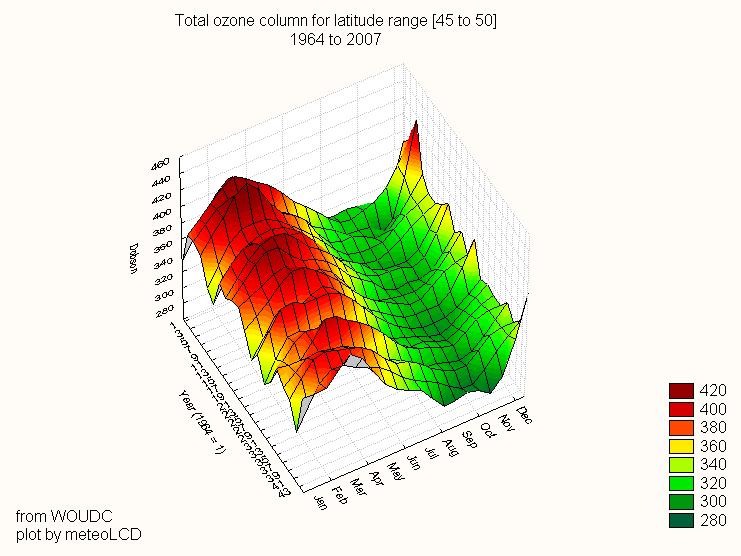
years. 2. New: to compare the 2023 TOC readings as published by Uccle on their website and meteoLCD measurements, look at these graphs (Excel file here) 3. 3D plot of total ozone column for latitude region [45 to 50] from 1964 to 2007 and maps of all of meteoLCD measurements (from WOUDC, many years missing!) 4. Older dobson files are in the data archive |
| Thickness of the ozone layer at Uccle | Measured by the Royal Meteorological Institute (RMI) of Belgium; shows mean and variance of all data from 1971 on. |
| Ozone Distribution (NH + SH) | Global Ozone maps from NASA |
| Northern Hemisphere Ozone Map (not available) | Ozone map generated from all Northern Hemisphere stations by the WOUDC |
| The
coordinates of DIEKIRCH are: latitude = 49°52' North longitude = 6°10' altitude = 218 m a.s.l. |
|
| Location | Date | UTC Time | Thickness [DU] | Sky Condition | Ozone&NO2 [ug/m3] ** |
| Diekirch | 31Dec23 | 13:42 | 303.4 | heavy clouds | 72.1 |
| Diekirch | 28Dec23 | 11:10 | 286.2 | heavy clouds | 69.2 |
| Diekirch | 26Dec23 | 12:37 | 260.6 | heavy clouds | 76.7 |
| Diekirch | 16Dec23 | 11:11 | 264.1 | blue sky | 49.2 |
| Diekirch | 15Dec23 | 13:03 | 275.0 | some clouds | 27.6 |
| Diekirch | 13Dec23 | 12:27 | 311.5 | some clouds | 66.1 |
| Diekirch | 11Dec23 | 13:17 | 281.3 | heavy clouds | 71.5 |
| Diekirch | 07Dec23 | 12:19 | 273.3 | heavy clouds | 40.1 |
| Diekirch | 06Dec23 | 13:26 | 278.7 | some clouds | 56.3 |
| Diekirch | 03DEc23 | 12:43 | 313.3 | hazy | 40.2 |
| Diekirch | 25Nov23 | 11:46 | 318.5 | heavy clouds | 58.4 |
| Diekirch | 22Nov23 | 12:07 | 242.9 | some clouds | 46.9 |
| Diekirch | 21Nov23 | 12:52 | 285.9 | many clouds | 56.5 |
| Diekirch | 20Nov23 | 11:10 | 295.9 | heavy clouds | 63.9 |
| Diekirch | 19Nov23 | 11:09 | 274.3 | some clouds | 79.4 |
| Diekirch | 17Nov23 | 11:10 | 313.0 | heavy clouds | 63.0 |
| Diekirch | 15Nov23 | 13:02 | 336.0 | many clouds | 71.5 |
| Diekirch | 08Nov23 | 12:05 | 337.6 | heavy clouds | 70.8 |
| Diekirch | 07Nov23 | 11:44 | 353.7 | heavy clouds | 72.5 |
| Diekirch | 06Nov23 | 13:23 | 320.3 | heavy clouds | 67.0 |
| Diekirch | 05Nov23 | 14:39 | 280.1 | heavy clouds | 64.5 |
| Diekirch | 03Nov23 | 11:18 | 380.5 | heavy clouds | 62.7 |
| Diekirch | 02Nov23 | 13:16 | 298.5 | heavy clouds | 79.1 |
| Diekirch | 01Nov23 | 10:08 | 283.4 | heavy clouds | 54.9 |
| Diekirch | 31Oct23 | 09:14 | 345.3 | many clouds | 70.3 |
| Diekirch | 27Oct23 | 11:08 | 288.5 | heavy clouds | 72.4 |
| Diekirch | 24Oct23 | 14:11 | 290.6 | some clouds | 70.1 |
| Diekirch | 21Oct23 | 10:43 | 283.9 | some clouds | 83.2 |
| Diekirch | 17Oct23 | 12:34 | 269.4 | some clouds | 50.5 |
| Diekirch | 16Oct23 | 11:17 | 272.3 | blue sky | 68.3 |
| Diekirch | 08Oct23 | 11:52 | 239.6 | some clouds | 71.3 |
| Diekirch | 07Oct23 | 11:58 | 237.8 | some clouds | 80.6 |
| Diekirch | 06Oct23 | 11:02 | 263.6 | some clouds | 54.7 |
| Diekirch | 04Oct23 | 12:00 | 299.0 | many clouds | 64.3 |
| Diekirch | 02Oct23 | 10:30 | 266.6 | some clouds | 48.3 |
| Diekirch | 01Oct23 | 12:14 | 266.8 | blue sky | 87.4 |
| Diekirch | 30Sep23 | 12:05 | 268.9 | some clouds | 77.5 |
| Diekirch | 28Sep23 | 10:43 | 280.1 | some clouds | 74.2 |
| Diekirch | 26Sep23 | 10:32 | 269.8 | blue sky | 48.8 |
| Diekirch | 25Sep23 | 10:30 | 264.7 | blue sky | 62.4 |
| Diekirch | 24Sep23 | 11:50 | 263.3 | blue sky | 77.6 |
| Diekirch | 22Sep23 | 11:58 | 315.5 | many clouds | 71.8 |
| Diekirch | 21Sep23 | 12:10 | 269.7 | many clouds | 75.5 |
| Diekirch | 19Sep23 | 10:20 | 280.7 | many clouds | 64.2 |
| Diekirch | 25Aug23 | 14:41 | 259.8 | many clouds | 101.7 |
| Diekirch | 23Aug23 | 10:40 | 277.3 | some clouds | 126.1 |
| Diekirch | 22Aug23 | 14:35 | 261.8 | some clouds | 125.5 |
| Diekirch | 20Aug23 | 08:20 | 277.0 | some clouds | 52.2 |
| Diekirch | 18Aug23 | 14:02 | 283.4 | some clouds | 118.0 |
| Diekirch | 17Aug23 | 12:23 | 297.8 | some clouds | 106.9 |
| Diekirch | 14Aug23 | 14:47 | 288.6 | many clouds | 87.0 |
| Diekirch | 24Jul23 | 12:10 | 333.8 | many clouds | 69.7 |
| Diekirch | 22Jul23 | 11:04 | 353.8 | many clouds | 106.7 |
| Diekirch | 21Jul23 | 11:40 | 350.3 | many clouds | 103.7 |
| Diekirch | 19Jul23 | 09:53 | 328.0 | some clouds | 117.2 |
| Diekirch | 18Jul23 | 10:05 | 335.9 | many clouds | 114.7 |
| Diekirch | 16Jul23 | 14:00 | 303.1 | many clouds | 94.1 |
| Diekirch | 15Jul23 | 10:03 | 332.7 | many clouds | 54.5 |
| Diekirch | 12Jul23 | 11:08 | 313.3 | many clouds | 84.2 |
| Diekirch | 11Jul23 | 11:17 | 303.1 | blue sky | 135.7 |
| Diekirch | 09Jul23 | 11:07 | 315.5 | very hazy | 149.6 |
| Diekirch | 08Jul23 | 12:26 | 306.8 | some clouds | 153.2 |
| Diekirch | 07Jul23 | 12:52 | 321.9 | light haze | 145.3 |
| Diekirch | 06Jul23 | 10:40 | 340.5 | some clouds | 92.1 |
| Diekirch | 05Jul23 | 11:08 | 357.4 | heavy clouds | 78.1 |
| Diekirch | 04Jul23 | 13:00 | 321.1 | some clouds | 97.3 |
| Diekirch | 03Jul23 | 11:22 | 311.3 | heavy clouds | 100.2 |
| Diekirch | 30Jun23 | 11:14 | 329.4 | very hazy | 101.2 |
| Diekirch | 29Jun23 | 10:26 | 309.0 | very hazy | 103.7 |
| Diekirch | 28Jun23 | 14:34 | 299.2 | many clouds | 119.7 |
| Diekirch | 27Jun23 | 11:46 | 318.3 | heavy clouds | 116.8 |
| Diekirch | 26Jun23 | 14:57 | 306.2 | some clouds | 126.5 |
| Diekirch | 25Jun23 | 12:50 | 299.6 | blue sky | 168.9 |
| Diekirch | 24Jun23 | 11:40 | 340.2 | some clouds | 155.7 |
| Diekirch | 23Jun23 | 12:27 | 311.7 | some clouds | 130.1 |
| Diekirch | 22Jun23 | 10:19 | 319.9 | many clouds | 91.6 |
| Diekirch | 21Jun23 | 11:16 | 315.8 | many clouds | 139.0 |
| Diekirch | 20Jun23 | 11:20 | 316.6 | some clouds | 147.1 |
| Diekirch | 19Jun23 | 14:56 | 315.1 | light haze | 137.3 |
| Diekirch | 17Jun23 | 11:41 | 338.7 | light haze | 191.1 |
| Diekirch | 16Jun23 | 11:18 | 352.0 | blue sky | 165.2 |
| Diekirch | 15Jun23 | 11:10 | 354.5 | some clouds | 145.6 |
| Diekirch | 14Jun23 | 11:21 | 352.3 | blue sky | 147.1 |
| Diekirch | 13Jun23 | 11:38 | 342.7 | blue sky | 160.5 |
| Diekirch | 12Jun23 | 10:42 | 329.5 | many clouds | 160.7 |
| Diekirch | 10Jun23 | 12:20 | 339.9 | many clouds | 159.2 |
| Diekirch | 07Jun23 | 09:33 | 378.3 | many clouds | 130.3 |
| Diekirch | 05Jun23 | 12:33 | 353.0 | some clouds | 139.9 |
| Diekirch | 04Jun23 | 12:53 | 351.7 | blue sky | 128.3 |
| Diekirch | 30May23 | 12:32 | 323.5 | blue sky | 120.9 |
| Diekirch | 28May23 | 12:30 | 338.5 | blue sky | 123.6 |
| Diekirch | 27May23 | 12:43 | 344.3 | blue sky | 108.8 |
| Diekirch | 25May23 | 10:18 | 346.1 | blue sky | 87.4 |
| Diekirch | 24May23 | 10:24 | 379.0 | blue sky | 80.0 |
| Diekirch | 22May23 | 10:30 | 328.3 | some clouds | 86.3 |
| Diekirch | 19May23 | 11:20 | 355.7 | some clouds | 97.4 |
| Diekirch | 18May23 | 11:11 | 350.2 | blue sky | 88.6 |
| Diekirch | 17May23 | 13:18 | 359.9 | some clouds | 91.8 |
| Diekirch | 16May23 | 11:19 | 351.3 | heavy clouds | 76.3 |
| Diekirch | 15May23 | 11:04 | 355.7 | some clouds | 122.7 |
| Diekirch | 14May23 | 08.55 | 351.7 | blue sky | 77.5 |
| Diekirch | 13May23 | 11:03 | 357.3 | some clouds | 107.6 |
| Diekirch | 12May23 | 13:10 | 330.5 | many clouds | 78.5 |
| Diekirch | 08May23 | 11:07 | 329.7 | some clouds | 87.6 |
| Diekirch | 07May23 | 11:16 | 334.1 | heavy clouds | 100.2 |
| Diekirch | 05May23 | 12:07 | 358.2 | heavy clouds | 76.6 |
| Diekirch | 04May23 | 11:20 | 340.0 | light haze | 103.6 |
| Diekirch | 03May23 | 11:28 | 339.5 | blue sky | 93.4 |
| Diekirch | 02May23 | 10:30 | 351.2 | many clouds | 76.0 |
| Diekirch | 30Apr23 | 10:04 | 317.7 | many clouds | 89.2 |
| Diekirch | 27Apr23 | 11:30 | 320.8 | hazy | 70.9 |
| Diekirch | 26Apr23 | 11:21 | 333.3 | many clouds | 78.1 |
| Diekirch | 25Apr23 | 11:19 | 378.0 | heavy clouds | 77.4 |
| Diekirch | 24Apr23 | 14:37 | 362.6 | heavy clouds | 83.7 |
| Diekirch | 20Apr23 | 12:33 | 390.0 | many clouds | 80.3 |
| Diekirch | 18Apr23 | 11:28 | 391.5 | many clouds | 73.0 |
| Diekirch | 16Apr23 | 12:12 | 377.3 | many clouds | 54.1 |
| Diekirch | 14Apr23 | 10:15 | 386.3 | some clouds | 80.3 |
| Diekirch | 12Apr23 | 11:30 | 354.9 | many clouds | 69.8 |
| Diekirch | 11Apr23 | 10:25 | 343.3 | many clouds | 82.0 |
| Diekirch | 09Apr23 | 09:30 | 364.2 | many clouds | 44.4 |
| Diekirch | 04Apr23 | 12:35 | 352.2 | many clouds | 73.3 |
| Diekirch | 03Apr23 | 11:35 | 383.8 | many clouds | 79.3 |
| Diekirch | 31Mar23 | 10:50 | 367.3 | heavy clouds | 76.7 |
| Diekirch | 30Mar23 | 11:33 | 337.1 | many clouds | 92.2 |
| Diekirch | 29Mar23 | 10:56 | 327.1 | many clouds | 54.7 |
| Diekirch | 28Mar23 | 11:12 | 340.2 | some clouds | 73.3 |
| Diekirch | 27Mar23 | 10:08 | 368.3 | many clouds | 71.2 |
| Diekirch | 26Mar23 | 11:13 | 381.2 | many clouds | 88.6 |
| Diekirch | 25Mar23 | 12:08 | 350.1 | some clouds | 84.4 |
| Diekirch | 24Mar23 | 11:02 | 328.3 | some clouds | 93.8 |
| Diekirch | 22Mar23 | 12:02 | 319.9 | heavy clouds | 82.7 |
| Diekirch | 18Mar23 | 13:06 | 346.9 | heavy clouds | 70.0 |
| Diekirch | 17Mar23 | 12:48 | 325.7 | heavy clouds | 74.5 |
| Diekirch | 16Mar23 | 12:01 | 327.2 | light haze | 75.8 |
| Diekirch | 15Mar23 | 12:30 | 358.6 | many clouds | 72.7 |
| Diekirch | 14Mar23 | 11:07 | 362.8 | heavy clouds | 73.3 |
| Diekirch | 11Mar23 | 12:08 | 376.8 | many clouds | 66.4 |
| Diekirch | 07Mar23 | 13:18 | 393.4 | heavy clouds | 53.1 |
| Diekirch | 03Mar23 | 12:05 | 352.6 | blue sky | 55.0 |
| Diekirch | 02Mar23 | 12:03 | 368.7 | blue sky | 61.9 |
| Diekirch | 01Mar23 | 12:01 | 329.4 | blue sky | 66.7 |
| Diekirch | 28Feb23 | 12:42 | 312.9 | many clouds | 56.9 |
| Diekirch | 27Feb23 | 11:02 | 336.5 | blue sky | 64.7 |
| Diekirch | 24Feb23 | 11:30 | 365.3 | blue sky | 67.4 |
| Diekirch | 22Feb23 | 11:02 | 323.5 | some clouds | 54.3 |
| Diekirch | 21Feb23 | 10:43 | 319.5 | blue sky | 29.5 |
| Diekirch | 20Feb23 | 10:45 | 288.2 | some clouds | 64.0 |
| Diekirch | 15Feb23 | 12:07 | 272.1 | many clouds | 30.2 |
| Diekirch | 14Feb23 | 14:35 | 230.4 | many clouds | 48.5 |
| Diekirch | 13Feb23 | 11:28 | 225.6 | some clouds | 53.9 |
| Diekirch | 10Feb23 | 15:00 | 233.3 | hazy | 52.2 |
| Diekirch | 09Feb23 | 12:51 | 296.9 | light haze | 49.2 |
| Diekirch | 08Feb23 | 10:49 | 280.0 | blue sky | 54.1 |
| Diekirch | 07Feb23 | 12:27 | 256.9 | blue sky | 53.6 |
| Diekirch | 06Feb23 | 11:59 | 266.3 | blue sky | 63.9 |
| Diekirch | 05Feb23 | 10:45 | 323.8 | many clouds | 74.1 |
| Diekirch | 02Feb23 | 12:59 | 318.5 | heavy clouds | 69.6 |
| Diekirch | 01Feb23 | 12:44 | 334.5 | heavy clouds | 72.1 |
| Diekirch | 30Jan23 | 12:08 | 264.9 | some clouds | 47.4 |
| Diekirch | 29Jan23 | 12:10 | 272.1 | light haze | 38.9 |
| Diekirch | 21Jan23 | 12:36 | 370.6 | light haze | 59.7 |
| Diekirch | 18Jan23 | 12:16 | 465.2 | light haze | 48.4 |
| Diekirch | 17Jan23 | 11:16 | 399.1 | some clouds | 57.6 |
| Diekirch | 15Jan23 | 09:54 | 371.7 | many clouds | 83.3 |
| Diekirch | 13Jan23 | 10:31 | 342.1 | many clouds | 83.6 |
| Diekirch | 11Jan23 | 14:00 | 295.8 | heavy clouds | 81.9 |
| Diekirch | 05Jan23 | 12:53 | 298.1 | many clouds | 73.3 |
| Diekirch | 03Jan23 | 12:23 | 370.4 | many clouds | 73.8 |
The total thickness of the
(stratospheric) ozone layer is measured at unspecified, irregular
intervals using the handheld
Microtops
II sensor manufactured by Solar
Light Company of Philadelphia. This instrument measures the
thickness of the ozone layer by computing the ratios of UVB irradiances
measured at three different wavelengths; the water vapour content of the
atmosphere and the AOT (aerosol optical thickness) are also measured by
the instrument.
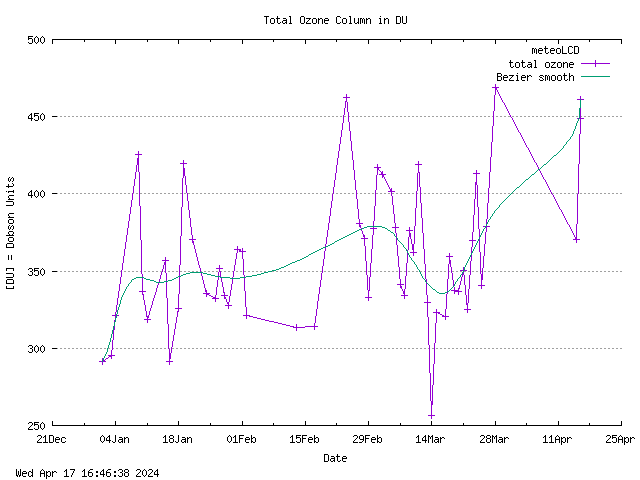
The measurement results are given in DU (Dobson Unit). 100 DU correspond
to a total thickness of 1 mm, if the ozone layer were at a standard
atmospheric pressure of 1013.25 [HPa]. Common values are in the 250..350
DU range.
The previous years dobsonyy.html files and the Microtops measurement files can be found in the data area!
Attention:
1. Starting 01-Apr-2021 a new calibration factor of 0.9466 is applied to #3012 measurements by Mike Zimmer. This new factor is the result of a comparison made from 08 to 23 March 2021. #3012 readings multiplied by this factor are given in blue.
2. Green DU's correspond to a new calibration factor of 0.9422 applied to #3012 measurements by Mike Zimmer starting 02Jun16 ! This new calibration factor has been found by a new comparison over several measurements made from March to July 2016.
Starting 15 Sep 2009, Microtops #5375 is
back from calibration at Mauna Loa. Purple data correspond to the new
calibrated readings. There is a big difference between the readings
before and after calibration. For some time, measurements will be made
with both Microtops, and a conclusion drawn thereafter.
Green ground ozone data should be considered unreliable!
(**) Ground ozone:
The O3&NO2 concentration is given for the actual
temperature and pressure conditions. It is NOT corrected for STP
conditions! As the NO2 concentrations is practically negligible (below
the sensor threshold of 40 ug/m3, the readings should be taken as O3
concentration.
The "old" CAIRSENS O3&NO2 has been replaced by a new
model the 15th May 2020. This new Cairsens seems to have a strong positive
bias. As our O3 values are very close to those measured by the official
station at Beckerich (confirmed by several comparisons), a calibration
function will be applied in the datalogger starting 1st July.
Correct_O3 =
1.074*reading - 36.309. This function as been applied to all the ground
ozone values from 16 May to 29 June (numbers in red) which have not been
corrected by the logger. Please read the
NEWS from 1 July 20 for the various graphs.
Update 01-Apr-2021: The calibration factor used in the logger has been
changed to 1/0.6656 and the offset to -27.8 (see the
NEWS from 31-Mar-2021). This will apply to
all readings from 01-Apr-2021 on.
Back to Home ............................................Please send all mail to francis.massen@education.lu