18
Dec
19 |
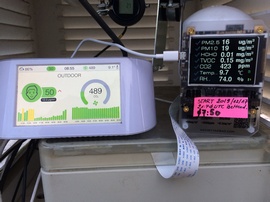
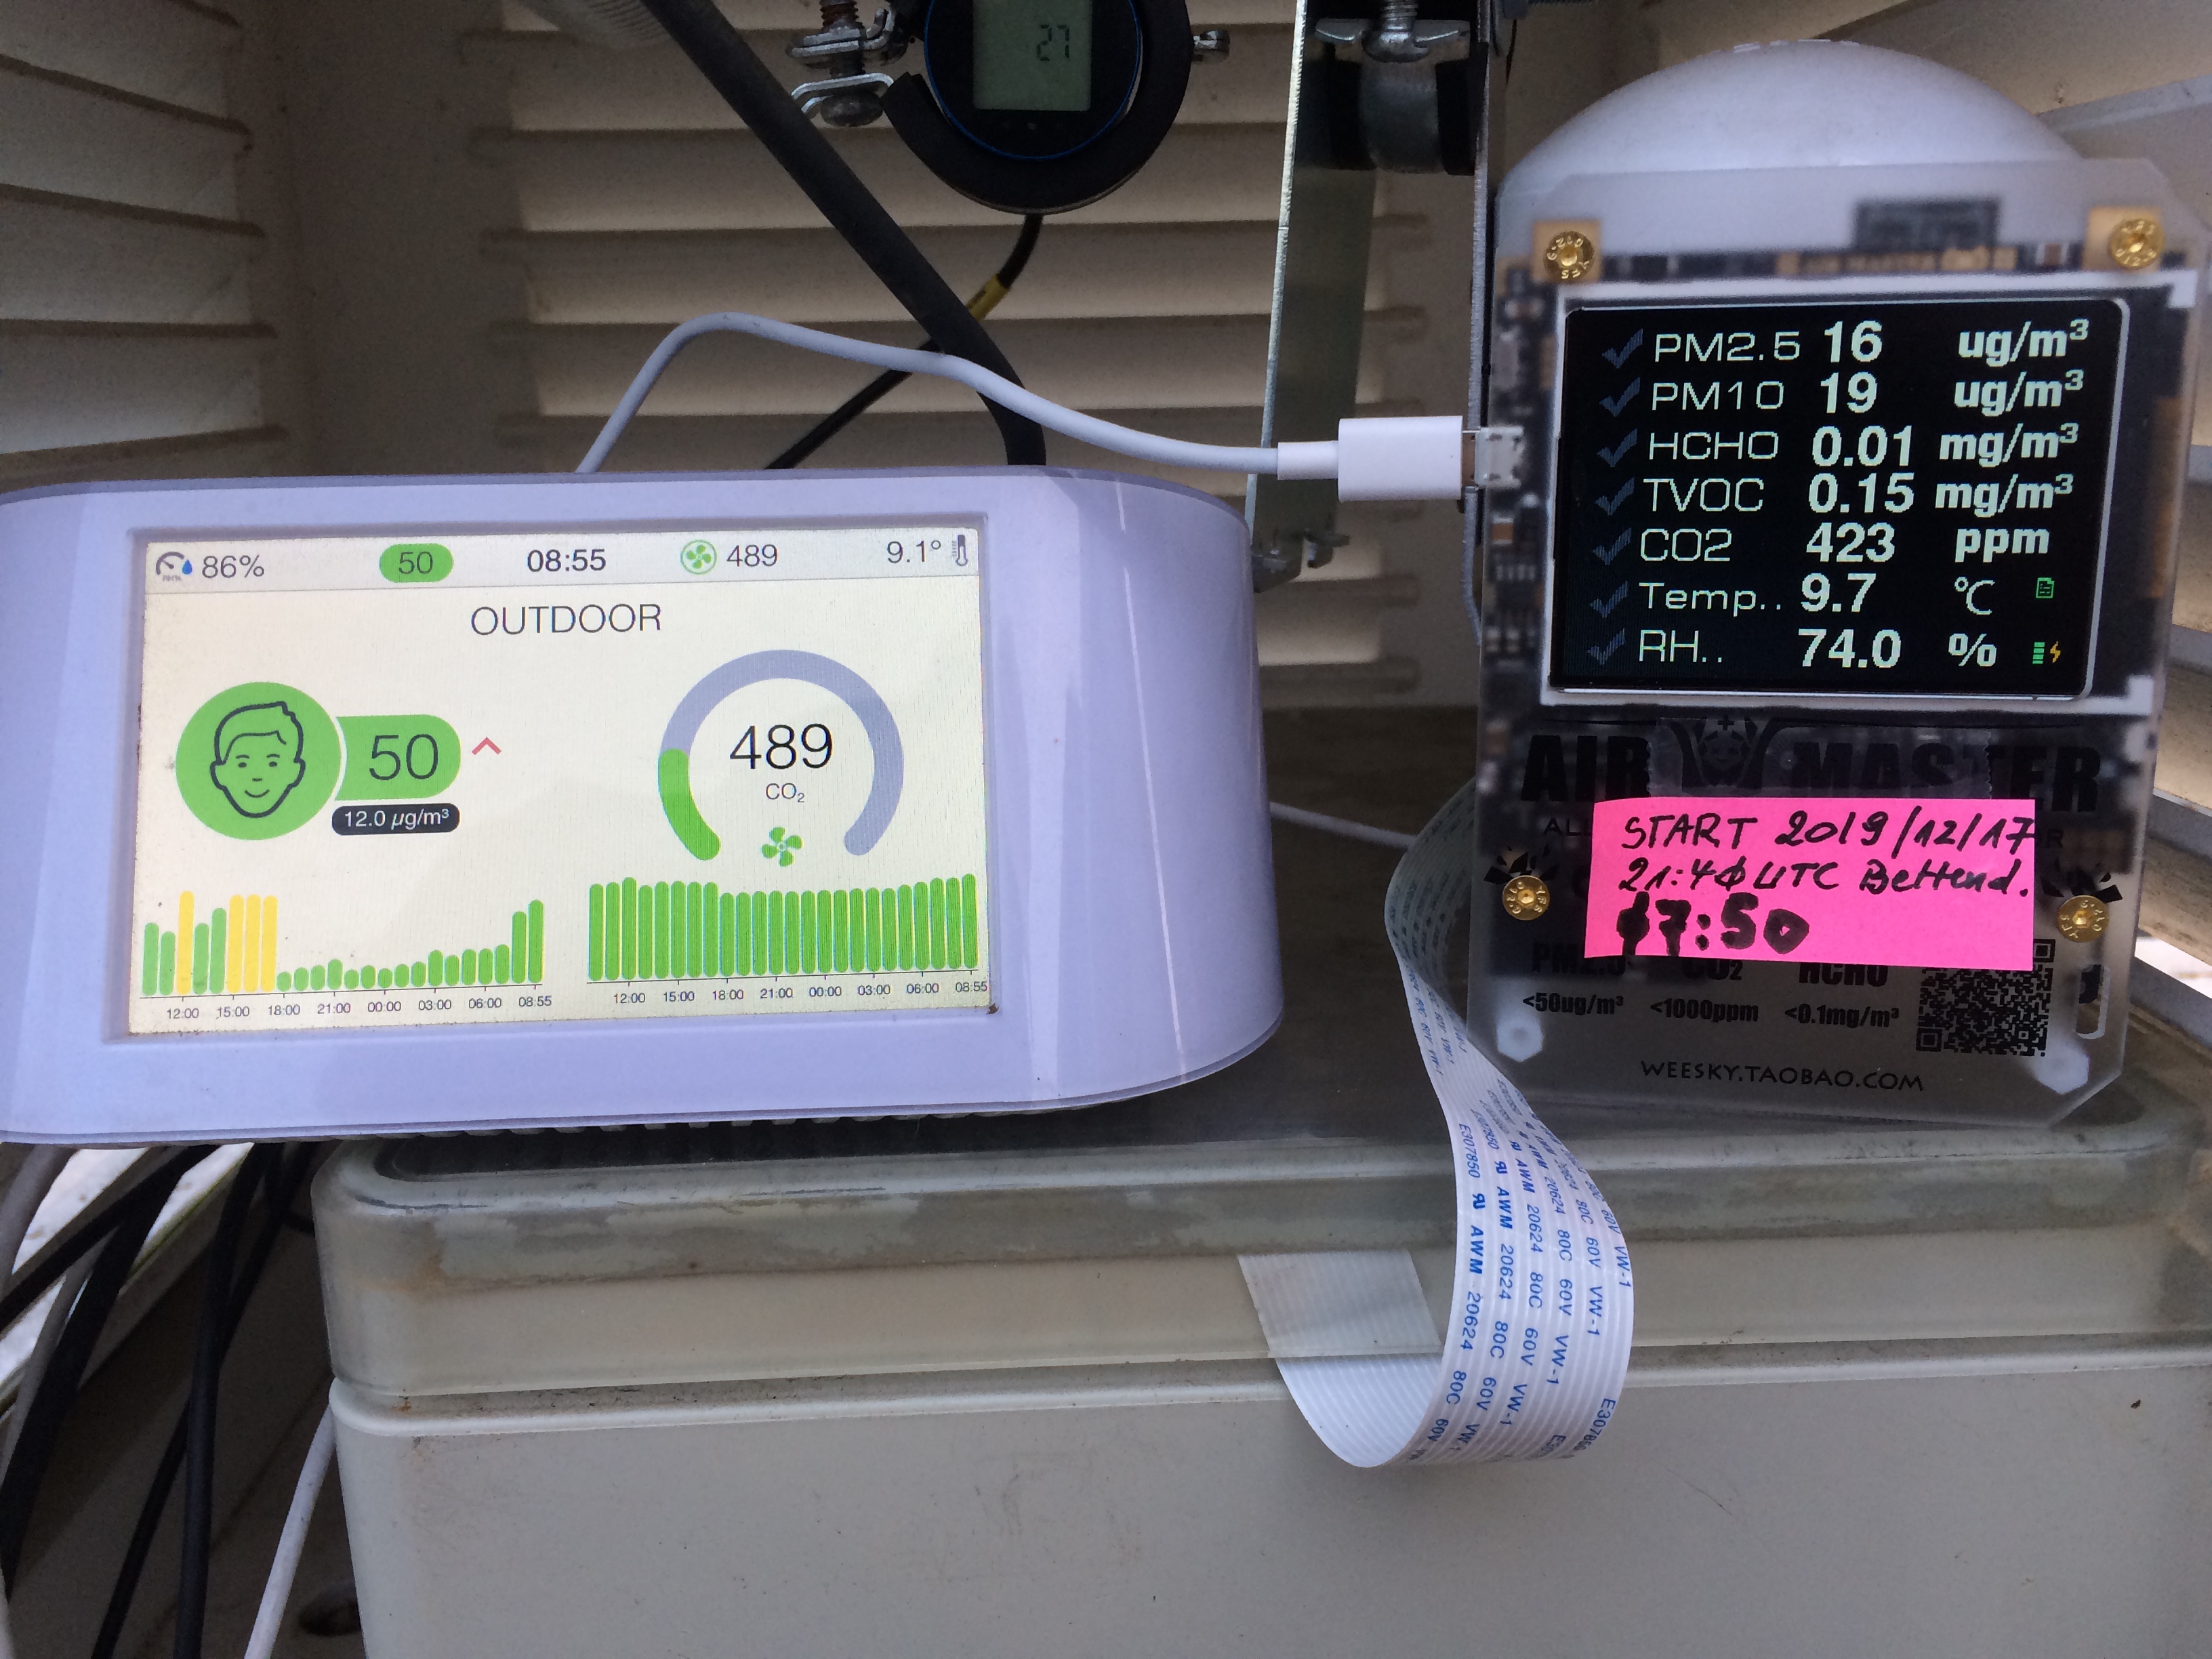
1. I installed today an AirmasterPro sensor in our Stevenson hut.
This is a self-contained instrument measuring and loggin PM25, PM10,
Formaldehyde (HCOH), total VOC, CO2, T and RH... quite a lot. So we
now have 3 concurrent sensors for fine particles (Airvisual,
PurpleAir amd Airmaster). Only the Airvisual data are transfered to
the internet, the other two sensors are logging their data on SD
cards.
2. Many years ago I received 3 disused sunshine duration HAENNI
Solar 111 sensors from ASTA (Services Techniques de l'Agriculture).
No scheme, no manual, just clipped of wires. By chance I found that
the Austrian company KRONEIS (we use their dew-point sensors in our
Phymoes Underground Climatology project in the 90's) still sells
these sensors. I contacted Kroenis and they sent me the pin-out.
Some quick test, and now we have one Haenni Solar111 working offline
(stores his data in vintage Mikromec data logger).
Click
here
for very short video showing the spinning shader. |
15
Dec
19 |
There was a problem with the thermal stabilization of the UVB
sensor. Corrected today at ~09:30 UTC. There are no consequences for
the UVB data. |
13
Dec
19 |
Dessicant renewal on both UV sensors (UVB and UVA). Possible
wrong/missing UVA and UVB data from ~ 09:00 to 10:15 UTC. |
01
Dec
19 |
Uploaded nov19.dat file into the
data archive. |
02 Nov
19 |
Uploaded oct19.dat file into the
data archive. |
26
Oct
19 |
We are probably on (or close to) the minimum of the annual Total
Ozone Column cycle: today our measurement shows 225.5 DU,
which is close to a record minimum for our region. Look at the 7
days data and see how diminishing TOC pushes up the UVB irradiance
(or the UVI if you prefer). These variations are natural, so no need
for angry meetings and shouting's! I am preparing a paper on this
interesting cycle which is practically sinusoidal. |
20
Oct
19 |
Rain sensor was blocked, and recipient close to overflowing. Cleaned
and let water drip down on sensor, so daily total (or monthly total)
will be more or less correct. The peak corresponds probably to the
cumulative rainfall of the last 3-4 days. Please compare to readings of the
backup station! |
01
Oct
19 |
Uploaded sep19.dat file into the
data archive. |
25
Sep
19 |
These days we had a nice illustration of radon washout by two
consecutive precipitation peaks: high than low for the first
situation, low than high for the second
More in the blog . |
1
Sep
19 |
The WBGT sensor has been stopped for this year (actually the pump
refreshing the distilled water reservoir has been shut off).
Clicking on the "NOT MEASURED" icons shows the 3 temperature
readings (W,B,G), with the wet thermometer not being wetted anymore. |
03
Sep
19 |
Uploaded aug19.dat file into the
data archive. |
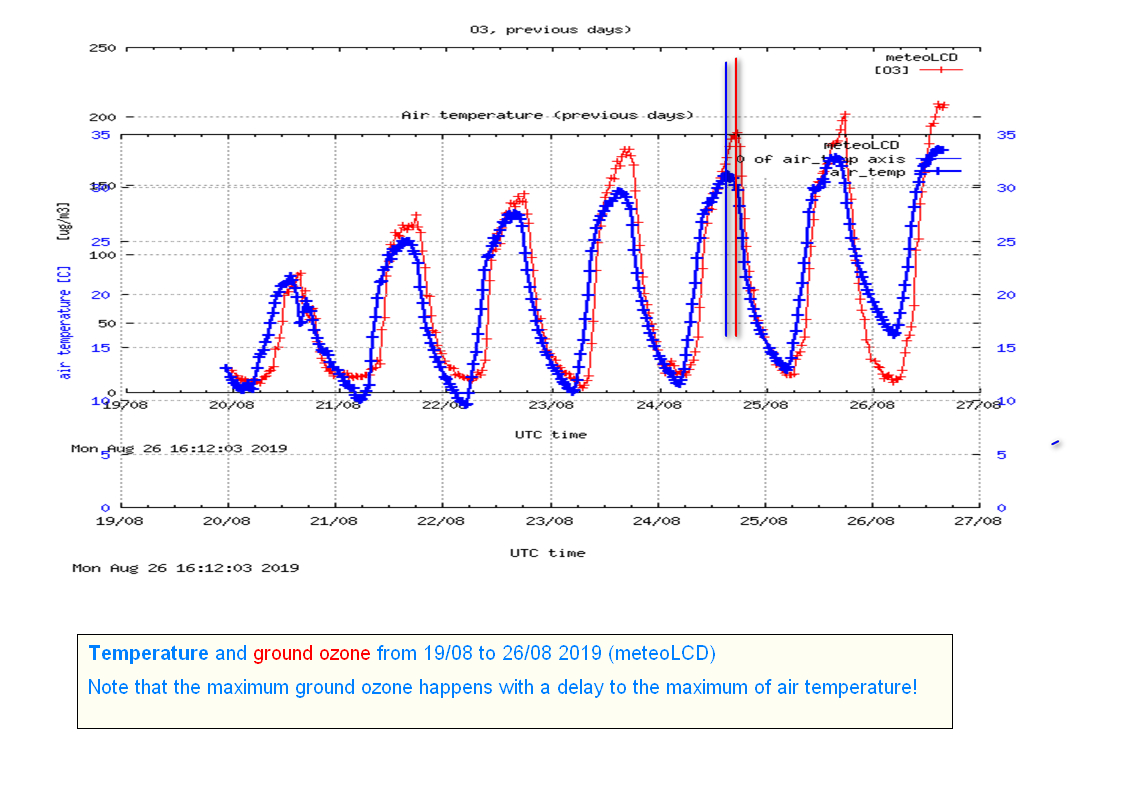
26
Aug
19 |
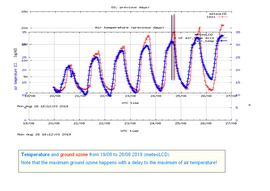
Click on the picture for a nice illustration how ground ozone and
temperature vary together, and notice the delay between the daily O3
and Air Temperature maxima. |
02
Aug
19 |
Uploaded jul19.dat file into the
data archive. |
23
Jul
19 |

Look at this picture from our heat stress sensor: natural cooling
(not forced cooling!) lowers air temperature by about 9°C. The heat
stress level of 31°C belongs to the 2nd category (out of 5) given
here, so we are far from an extreme situation... Nevertheless do
not forget to hydrate! |
13
Jul
19 |
The thunderstorm yesterday showed a problem with our lightning
sensor: it did not display flashes inside the 25km zone. I just
checked the outside antenna and thoroughly cleaned the RJ45
connector...let's wait for the next storm to see if this helped. |
08
Jul
19 |
I replaced the Delta_T logger by a spare one (same model); the
problem of the jitter could be a creeping malfunction of one of the
input boards...so just to be sure the old logger was replaced by a
spare having identical hardware configuration... First check give a
hint that this is successful...
Confirmation at 18:00 UTC. The jitter problem seems to be solved... |
07
Jul
19 |
Still searching for the cause of jitter...some servers (like CO2)
have been shut off...please bear with me the disturbances... |
06
Jul
19 |
Continuing the search for the cause of the pressure jitter the
barometric sensor has been switched of at 16:00 UTC...this allows to
check if the jitter (also visible in the radioactive measurement) is
still present (and so not caused by the barometer). I also rerouted
everything around the UPS, so that this possible cause is also
eleminated... |
04
Jul
19 |
I continue the investigation to find the cause of the barometer and
radioactivity jitter. Installed separate 12VDC power-supply for
barometer; signal - (signal GND must be connected to logger GND).
Inspection later today or tomorrow will tell if this helps.
Inspection of the raw input voltage into the logger suggests
stability...(slow jitter only 0.1 mV). |
01
Jul
19 |
1. Raoul Tholl and myself checked and cleaned the Vaisala CO2
sensor; actually both the mirror and optics were quite clean, after
2 years of flawless operation.
2. We searched for the cause of the jitter on the barometric sensor
and the radioactive readings. One sure culprit is the Fritz
powerline system I installed to drive the Airvisual Pro PM sensor
(but it may not be the sole cause!). I removed the powerline system
and mounted a Netgear AP directly into the waterproof box inside the
Stevenson hut. It was not easy to pull a RJ45 cable from the
computer room to this hut, and it is a bit kludgy, but works. Tests
with a AP located in the computer room showed that the WLAN signal
was very poor, as attenuation by the steel-reinforced ceiling and
metal cladding is strong, so the AP had to be installed close to the
Airvisual sensor who communicates only by WiFi. The new system
started about at 16:00 UTC today.
3. Uploaded jun19.dat file into the
data archive. |
|
28 Jun 19 |
Replaced the peristaltic pump of the WBGT sensor by a new one. As
the flow rate is higher, pumping time has been reduced to 1 minute
per session, and 5 sessions defined. |
26
Jun
19 |
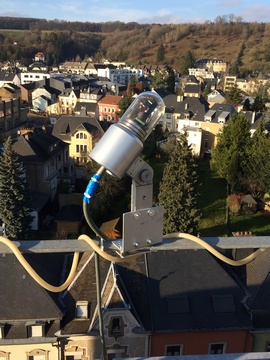
Changed dessicant on CM21, UVA and UVB instruments. The O3 (ground
ozone) readings of the CAIRSENS sensor seem a bit overblown; I
changed the special inlet filter. The clock timing the distilled
water pump for the wet bulb sensor seems to have a bad character:
somehow during the night the power on sequence (which should time
out after 2 minutes) was stuck in the ON position, and the water
storage canister ran dry. I changed the clock, checked 5 times the
correct programming, and we will see... The WBGT readings for today
are all ok. In these hot days, you may look at this table for the
WBGT threshhold conditions, which depend on the % of work
done:
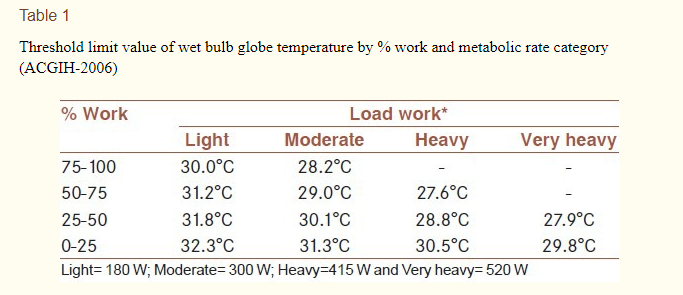
Notice that today we exceed the conditions for light work from
10:30 local time on (WBGT > 30°C).
Click
here and
here
for further information on heat-stress and WBGT measurement, and
here is our equipement:
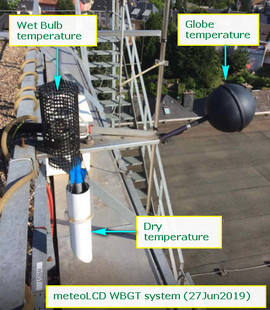 |
24
Jun
19 |
1.
The 17th and 24th June 2019 two classes (about 25 students each) of
the LTPS (Lycée Technique pour les Professions de la Santé) of
Luxembourg visited meteoLCD, watched some demonstrations and
listened to a presentation by F.Massen titled "Changement climatique...pas
de panique!". Our member Raoull Tholl who teaches physics at the
LTPS has organized these visits.
2. The wet bulb sensor of the WBGT heat-stress sensor ran dry this
morning after 10:00; has been refilled and everything ok since
12:00. Look
here
to watch how wet bulb temperature goes up and down. |
01
Jun
19 |
Upload may19.dat into data
archive. |
|
24 May 19 |
There was an interruption due to a problem with our main computer;
relaunched this morning: ok. No data will be lost, as everything is
stored on the datalogger. |
17
May
19 |
1. Reactivated the heat-stress sensor display (even if times
they are chilly...but this surely will change in the upcoming weeks)
2. Backup work on the main Lubuntu replacement computer. |
|
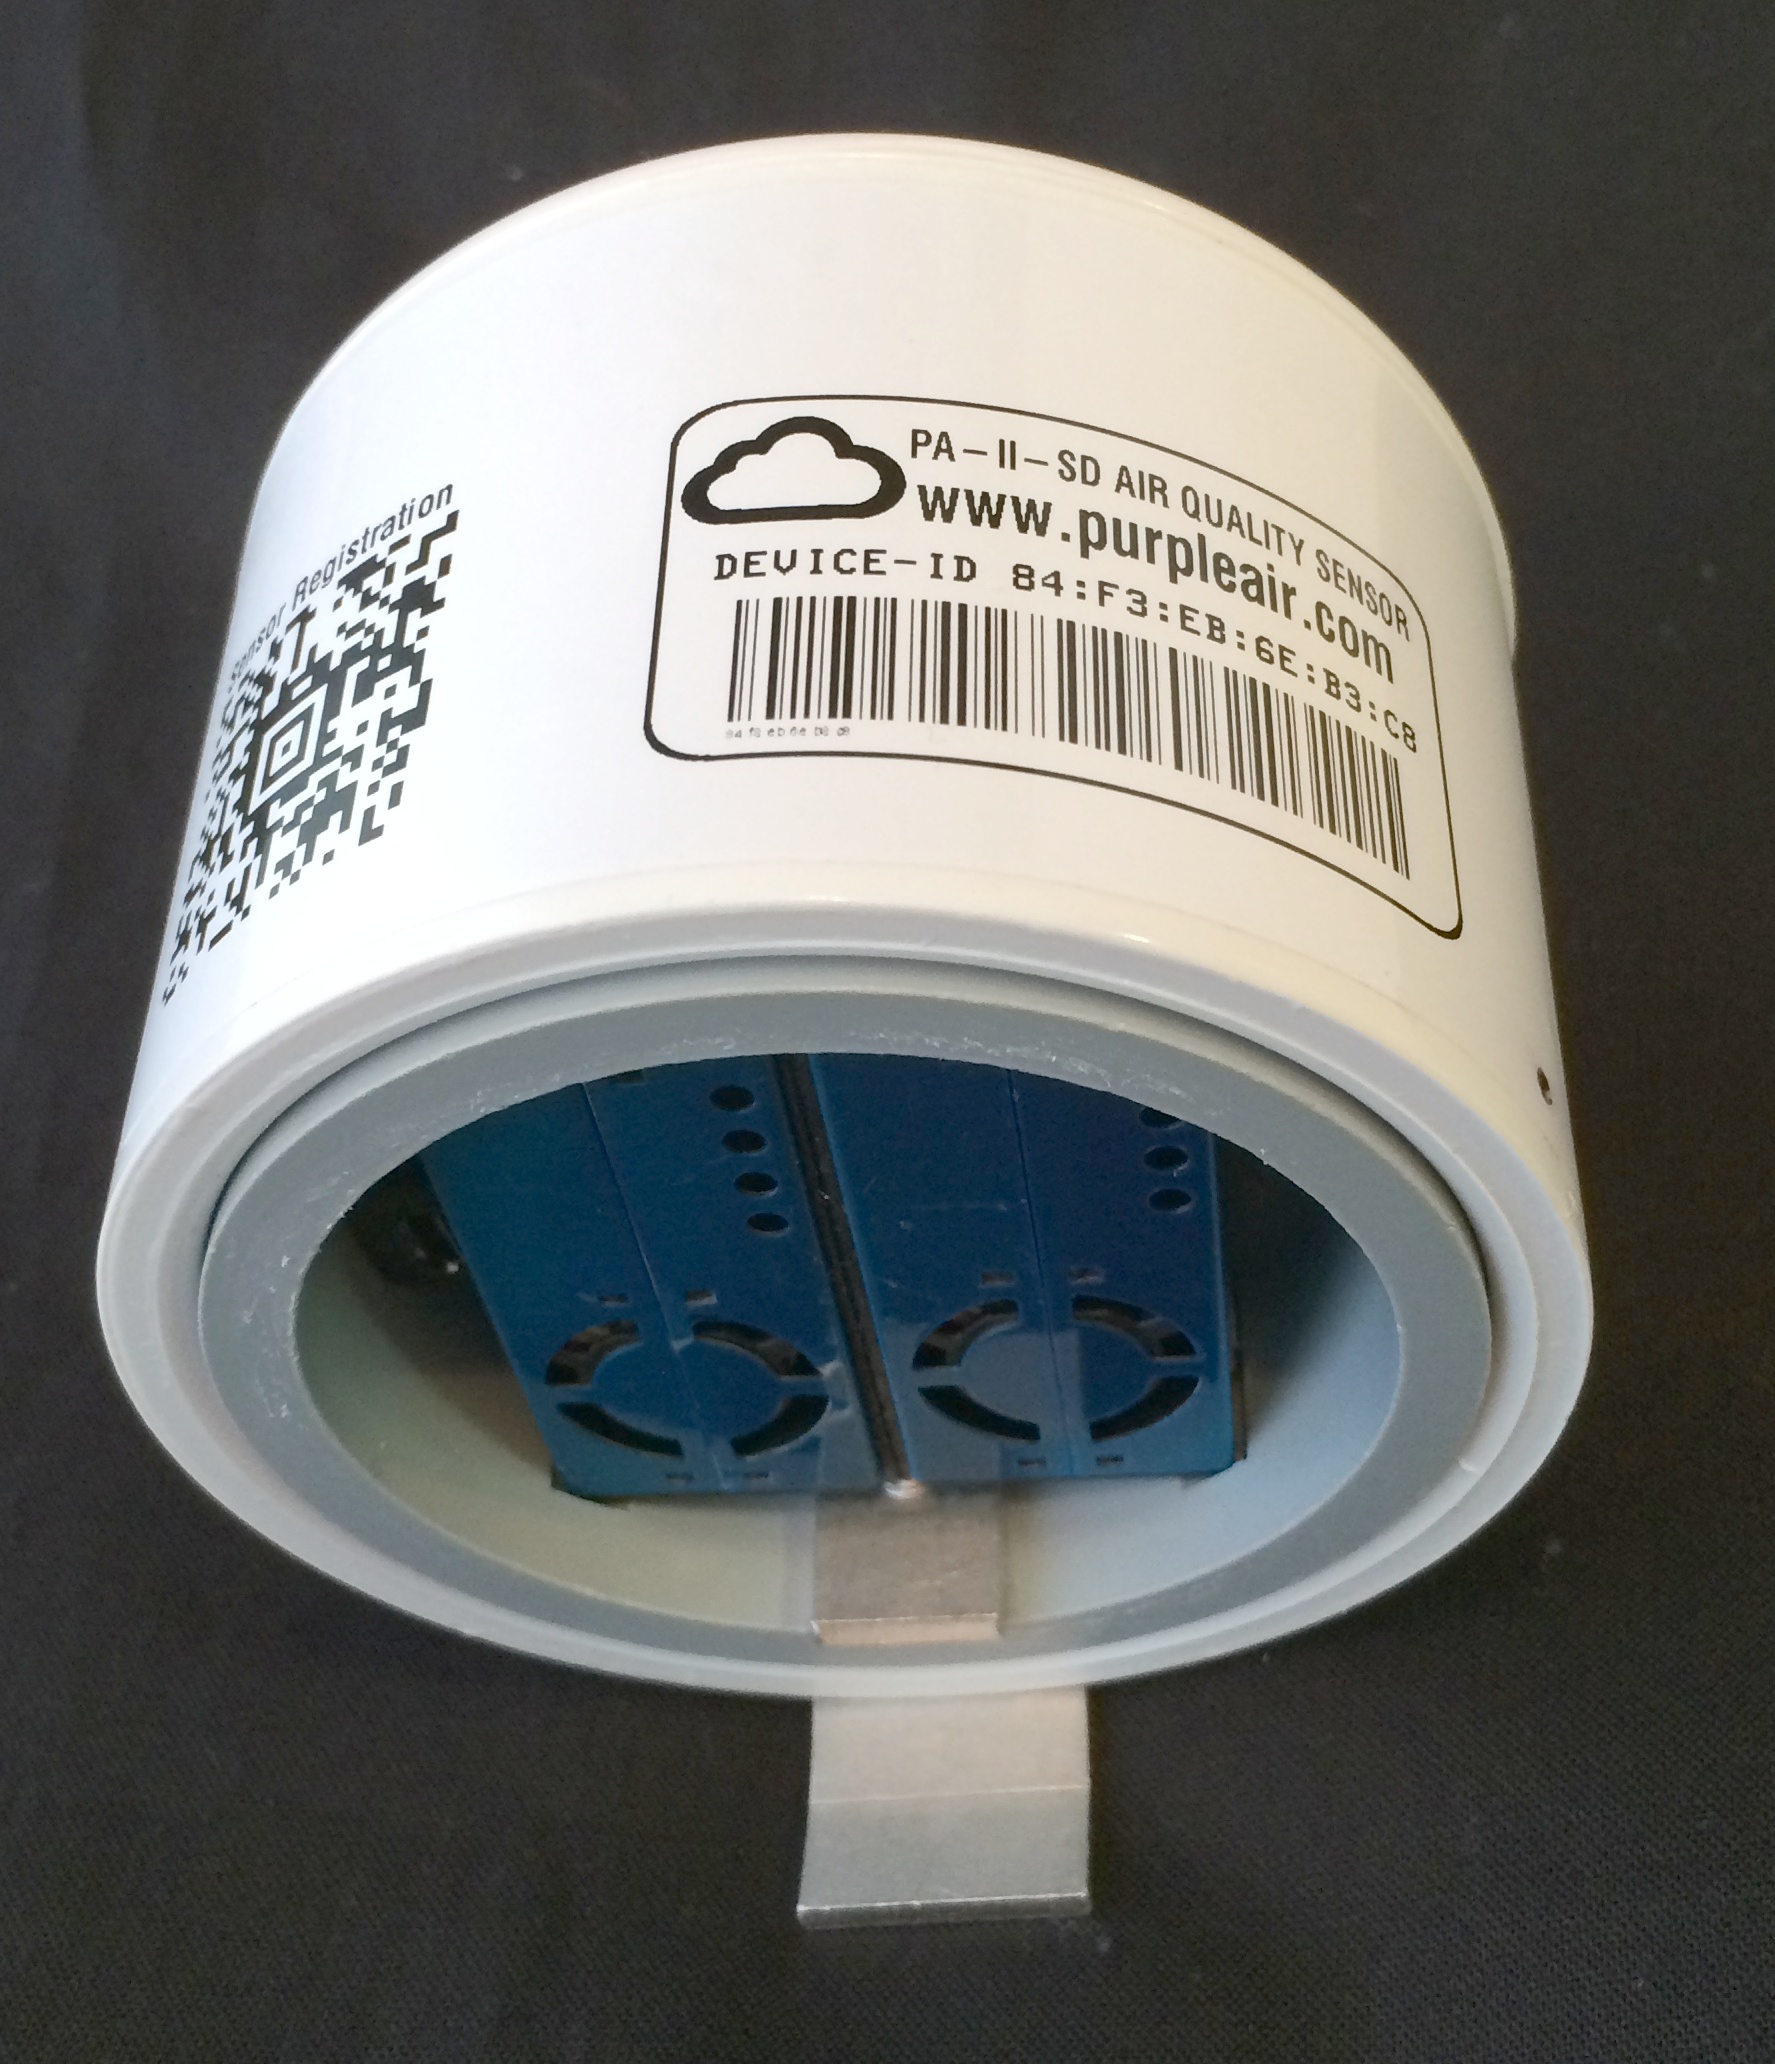
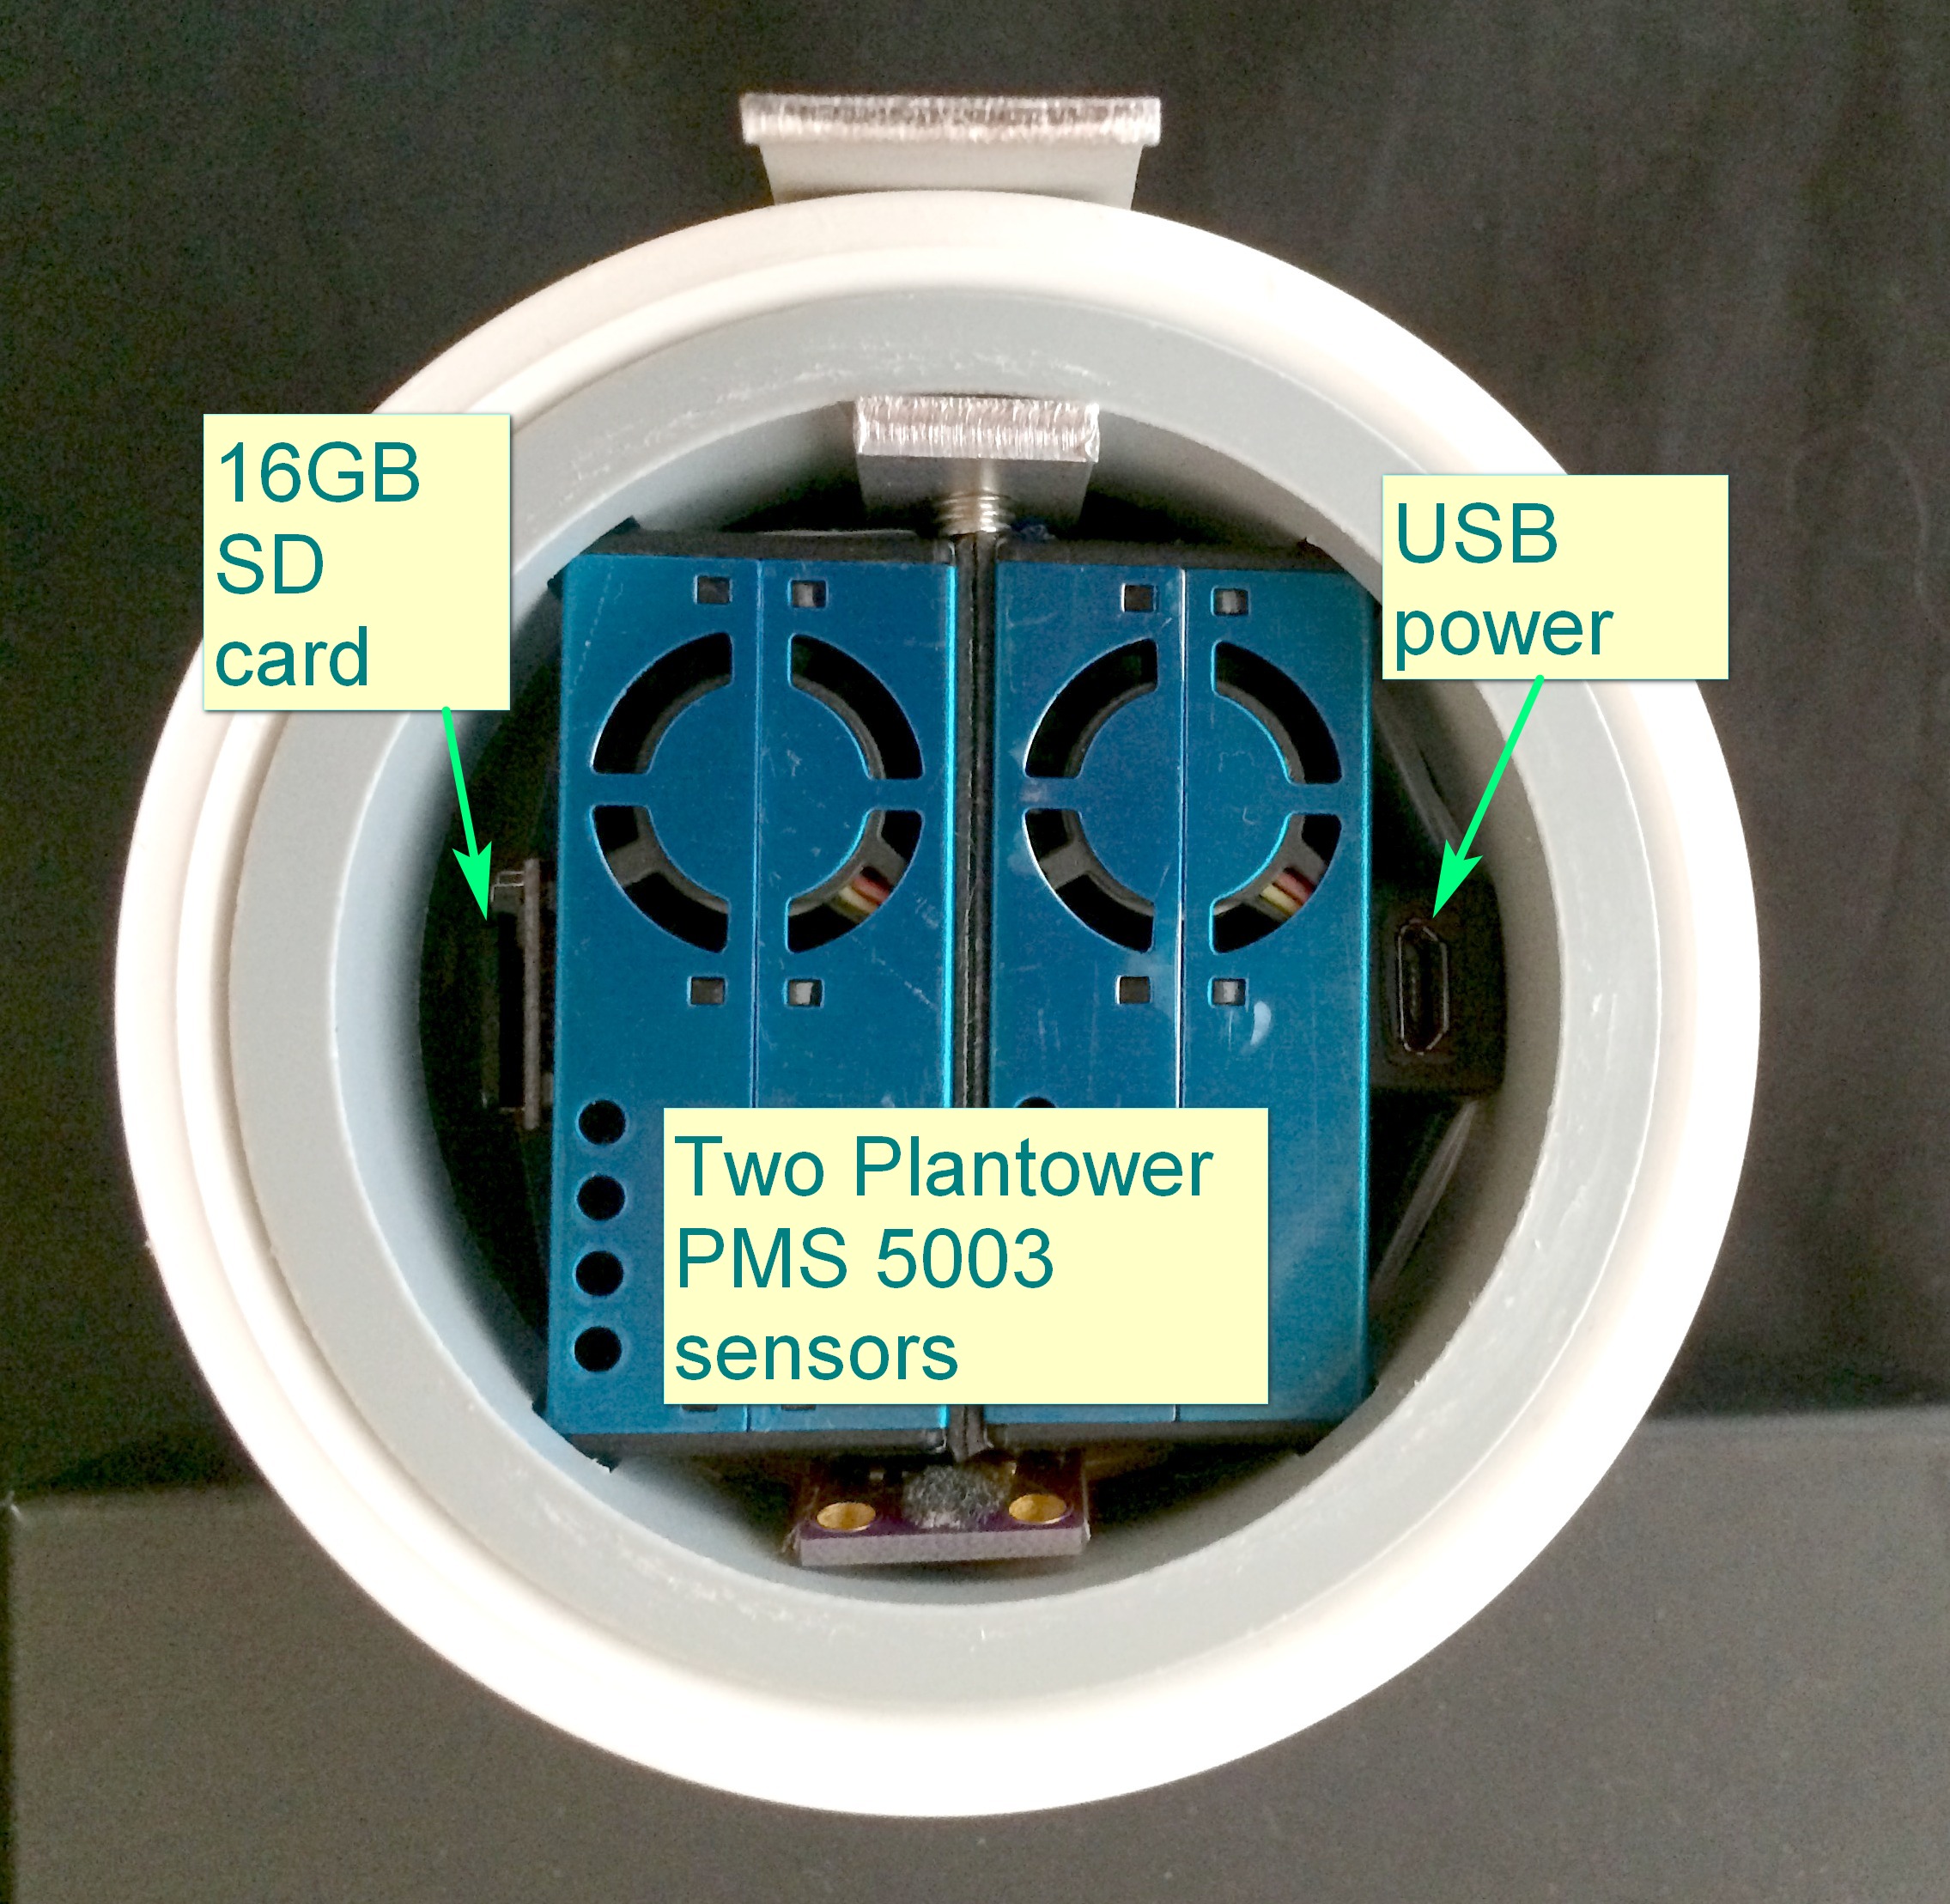
02 May 19 |
1. Following some email exchanges with a professor from the SIUE
(Southern Illinois University Edwardsville) I installed today a
PurpleAir fine particle sensor in offline mode. The sensor
records PM 1.0, PM 2.5, PM 10 and also the raw particle counts (*) on a
.csv file of the internal SD card (as well as temperature, pressure
and relative humidity), data which will be used later for
comparisons and calibration research.
 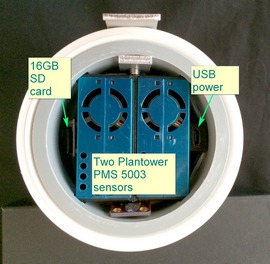
As shown on the pictures, the PurpleAir has two Plantower sensors
in parallel, and the measurements of both are recorded so to have
some sort of confidence check.
(*) Did you know that there are about 20000 fine particles > 0.3
micrometer in one liter of rather clean air?
2. We ( F. Massen, C. Baumann, R.Tholl, M. Zimmer) posted a
very short paper in the
papers section
which compares our first Airvisual PM measurements with those made
by the official Beidweiler station. The Airvisual data (daily
average) must be corrected for high humidity levels, and follow the
official ones quite nicely.
3.
Upload apr19.dat into data
archive |
|
30Apr19 |
1. The new barometer has big swings in its output signal; I tried to
smooth this out with different capacitors, but no great success for
the moment. The oscilloscope shows that the signal is noisy by <10mV
which corresponds to about 6 HPa. Tried now using a 100uF Elko.
2. Big catastrophe with the old ESR backup pyranometer
(channel 23). There is a 4-20mA converter at the outlet of the
pyranometer, and the box holding this module was filled with
rainwater, which badly corroded all contacts and gave meaningless
readings since the 05Apr2019. Luckily the electronic module
survived, and after thoroughly cleaning the contacts the sensor is
working correctly again (since 09:00 UTC today). |
|
08Apr19 |
Raoul and I replaced the old BS4 barometer (in use since 1994!) by a
new one (Fischer FI05). The BS04 had some age-related jittering
since over a year, and it was time to put him at rest. We had to
shutoff some sensors and change the logger configuration. So do not
be afraid by unusual readings in the plots and data-file, they will
disappear by magic during the coming days... |
|
03Apr19 |
1. The PM2.5 seems not to have been updated on the Airvisual cloud
for a day, but the equipment works correctly here at meteoLCD.
Problem seems to have been cleared today morning.
2. Installed new CAIRSENS O3/NO2 sensor (serial 5409) as a
replacement for the old one which has come (or even exceeded) its
normal lifespan of 1 year. These sensors are built to work without
calibration (except 3 filter changes) for one year. Our experience
(> 12 months) of the first sensor was very satisfying: the readings
are in excellent conformity to the official ones. Calibration
certificate
here. |
|
02Apr19 |
Upload mar19.dat into data
archive |
|
01Apr19 |
Backup station ok again. |
|
29Mar19 |
The Thinclient comnputer driving the Davis Backup station is sick.
Will be replaced asap. |
|
25Mar19 |
Installed new AVM 1220E/1260E powerline/WLAN combo to drive the
Airvisual PM2.5 sensor. |
|
17Mar19 |
Again a problem with the Devolo Powerlink tying our Airvisual PM
sensor into the Lan. The PLC looses contact with the AP installed in
the Stevenson hut on the terrace, for no apparent reason. I will
probably replace the Devolo system by a AVM PLC which uses all 3
wires (neutral, line and ground); an installation I made at home
showed that this system works much better in dubious/complicated 220
VAC installations. |
|
01Mar19 |
Upload feb19.dat into data
archive |
|
27Feb19 |
The axis orientation of our PM2.5 measurement at the
airvisual.com website were a bit confusing (timing increased either
from left to right or right to left). This seems now ok: click
for annotated pictures of the
hourly and
daily graphs. |
|
14Feb19 |
Trends 1998
to 2018 analysis finished! |
|
13Feb19 |
Look at the Dobson (Total ozone) page for two plots comparing the
ozone measurements done at Uccle with the very expensive Brewer
MkIII (serial 178) and our Microtops (serial 5375) instrument during
2018. There are 180 same day, direct sun comparable measurements.
The two
series and the
calibration curve. I think we can be very satisfied with these
results! |
|
01Feb19 |
Upload jan19.dat into
data archive. |
|
18Jan19 |
I started with the update of the
trends
section. This is heavy work and will take some time to finish.
Updated sections are clearly marked as such. |
|
10Jan19 |
The
Airvisual web site of meteoLCD is now complete, with all data
missing during the first days (like Temp, Humidity, ...) and
forecast now present. Look also at the Airvisual quality map,
which allows easy picking of stations, worldwide: https://www.airvisual.com/air-quality-map
Be aware that this map gives all available stations, without
specifying wether they are official ones or come from the Airvisual
community (for Luxembourg, meteoLCD is a community station, the
others are those of the Environmental Agency).
You might re-read my
multi-part blog on air quality and AQI. |
|
09Jan19 |
Big news: our Airvisual Pro station to measure air quality
(essentially PM2.5 fine particles concentration) has been accepted
into the world-wide Airvisual network of AQI stations. The
reported AQI is the US AQI, as defined by EPA. Click here:
https://airvisual.com/luxembourg/diekirch/diekirch/meteolcd
This link will be added to the page of live data.
Attention: on the hourly graph, the most recent values are at
the left! The time axis decreases from left to right (don't ask
why...) Monday 14 January:
This unusual behavior has been changed: the time axis now
shows the most recent hourly measurement at the right (time
increases from left to right).
|
|
06Jan19 |
Added file 2018_only.xls
to data archive. This file contains all the meteoLCD measurements of
the year 2018, some statistics, daily and monthly values and
comparisons with measurements done at the Meteolux station at Findel
airport. |
| 01Jan19 |
1. The usual dogs-dinner in the 7days plot due to Gnuplot problems
with handling previous and new year (the logger files do not contain
the year number). This will be self healing in the next 7 days.
2. Upload dec18.dat into
data archive.
|


